AI Analysis
Generated: 10 weeks ago. (Likely Outdated!)
Amazon.com, Inc. (Ticker: AMZN) is a global powerhouse that has built its business on a few key pillars, constantly innovating and expanding its reach. Think of it as a company with several distinct, yet interconnected, engines driving its growth.
The Business Model (How They Make Money)
Amazon's core economic engine is a powerful combination of online retail, cloud computing, and a rapidly growing advertising business. They essentially make money in three main ways:
- Selling Stuff Online (and letting others sell too): This is Amazon's original business. They sell products directly to customers through their websites (Online Stores) and also provide a massive platform for millions of other businesses to sell their goods (Third-Party Seller Services). They earn a cut from these third-party sales, along with fees for services like fulfillment and shipping. In 2025, their Online Stores generated $269.29 billion in revenue, representing 37.56% of their total revenue, while Third-Party Seller Services brought in $172.16 billion.
- Powering the Internet (AWS): Amazon Web Services, or AWS, is their cloud computing arm. It provides businesses, from startups to large enterprises, with computing power, storage, databases, and other technology services over the internet. This segment is a significant profit driver for Amazon. In the second quarter of 2026, AWS net sales surged to $42.2 billion, growing 37% year-over-year. For the full year 2025, AWS generated $128.73 billion in revenue, accounting for 17.96% of Amazon's total revenue.
- Showing You Ads: Amazon leverages its vast customer data and high traffic on its e-commerce sites to sell advertising space to brands. This is a high-margin business that has been growing quickly. In Q2 2026, advertising services revenue was $19.8 billion, a 26% increase from the prior year. For the full year 2025, Advertising Services generated $68.64 billion in revenue, making up 9.57% of total revenue.
- Memberships and More (Subscription Services): This includes revenue from Amazon Prime memberships, which offer benefits like faster shipping, streaming video, and music. It also includes other subscription offerings. In 2025, Subscription Services generated $49.62 billion in revenue.
For the second quarter ended June 30, 2026, Amazon reported total net sales of $200.6 billion. For the full year 2025, total net sales were $716.9 billion.
The Metrics That Matter Most
For Amazon, with its diverse operations and heavy investment strategy, these are the most critical pulses to check:
- Revenue: This metric simply tells you the total amount of money Amazon brings in from all its sales before any expenses are taken out. For a company like Amazon that is constantly expanding into new areas and growing its existing businesses, looking at its overall revenue growth is crucial to understand if it's successfully attracting more customers and increasing its market share across its various segments, from online shopping to cloud services. Amazon's net sales for the second quarter of 2026 were $200.6 billion, a 20% increase from the same period in 2025.
- Operating Income: This shows how much profit Amazon makes from its core business activities after covering the direct costs of running those businesses, but before accounting for things like taxes or interest payments. It's especially important for Amazon because it helps us see the profitability of its different segments, like how much profit comes from AWS compared to its retail operations. A strong operating income indicates that Amazon's main businesses are running efficiently and generating healthy profits. In Q2 2026, Amazon's operating income was $27.5 billion, a significant 43% increase from Q2 2025. AWS alone contributed $16.6 billion to operating income in Q2 2026.
- Free Cash Flow (FCF): This is the cash a company generates after paying for its day-to-day operations and all the investments it needs to grow, like building new warehouses or data centers. It's a very important measure because it shows how much cash is truly available to pay down debt, buy back shares, or even fund new ventures without needing to borrow more money. For Amazon, which invests heavily in its infrastructure and new technologies, FCF tells us if these investments are ultimately leading to more cash in the bank. For the trailing twelve months ended June 30, 2026, Amazon reported a free cash flow outflow of $7.6 billion, primarily due to a substantial increase in property and equipment purchases, largely for artificial intelligence investments. This compares to an $18.2 billion inflow for the trailing twelve months ended June 30, 2025.
- Capital Expenditures (CapEx): This metric represents the money Amazon spends on buying, maintaining, or improving its physical assets, such as warehouses, delivery vehicles, and, critically, data centers for AWS. For Amazon, CapEx is a huge indicator of its investment in future growth. High CapEx often means the company is building out its capacity to handle more e-commerce orders or expand its cloud computing services, especially in areas like AI. Understanding CapEx helps investors gauge the scale of Amazon's long-term strategic investments. Amazon's full-year 2026 capital expenditure forecast has been raised to approximately $220 billion, up from earlier projections, primarily due to higher memory costs for AI infrastructure.
How to Value This Company
The most relevant valuation metric for Amazon, given its significant investments and focus on generating cash over the long term, is FCF Yield.
FCF Yield helps you figure out if a stock is cheap or expensive by comparing the company's Free Cash Flow (the cash it truly generates after all expenses and investments) to its stock price. You calculate it by taking the Free Cash Flow per share and dividing it by the stock price. Think of it like the "cash return" you'd get if you bought the entire company.
Here's why it's great for Amazon: Amazon has historically prioritized investing heavily in its business to fuel future growth, which can sometimes make its traditional earnings (net income) look lower. However, Free Cash Flow gives a clearer picture of the actual cash being generated by the business. A higher FCF Yield suggests you're getting more cash flow for every dollar you invest in the stock, which could indicate it's a better value. Conversely, a lower FCF Yield might mean the stock is more expensive relative to the cash it's generating. While Amazon currently has a negative FCF, understanding the reasons behind it (massive AI investments) and how that might translate to future cash generation is key to using this metric effectively for valuation.
⚠️ Disclaimer: This analysis is generated by AI. stockpicker.tech is not responsible for any mistakes, inaccuracies, or hallucinations. This is for educational purposes only and does not constitute financial advice. Users should always double-check the information and conduct their own research before making investment decisions.
Log in to generate a MOAT report for this stock.
Log in to generate an earnings report for this stock.
Log in to generate an operating leverage report for this stock.
Log in to generate a management report for this stock.
Log in to generate a valuation report for this stock.
Amazon.com, Inc.

Analysis: AMZN
All analysis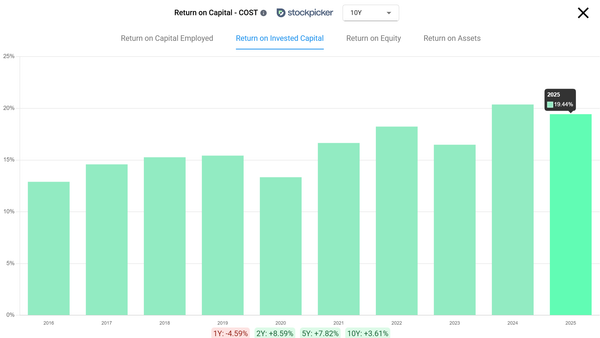
What Is a Good ROIC for a Company?
TL;DR * A good ROIC is above 12%. Above 15% is considered strong. * What counts as good depends on the cost of capital. Most large companies pay 8% to 12%, so a 10% return is standing still. * A high return only matters if the company still has somewhere to reinvest. 20% with a runway beats 40% without one. * ROIC…
Is Amazon (AMZN) a Robotics Stock? 1 Million Robots and a Cash Flow Multiple Below Google's
TL;DR Is Amazon a robotics stock? Yes. Amazon is the customer here, not the supplier. Every dollar the robots save stays inside its own margins. * Amazon runs over 1 million robots. They touch roughly 75% of all customer orders. In 2020 the fleet was 200,000. * It owns Zoox (self-driving, $1.2B in 2020). It is testing…
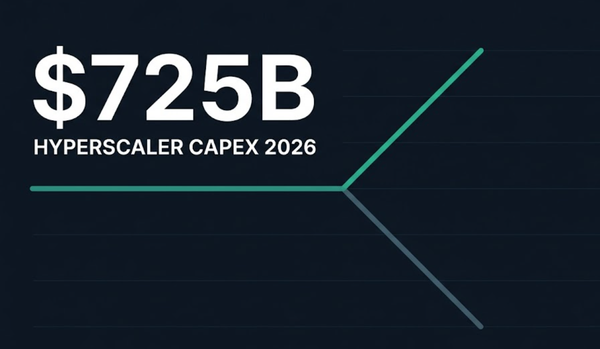
Hyperscaler CapEx Is the Only Metric That Matters Right Now
TL;DR: * The four largest hyperscalers are set to spend roughly $725 billion on capex in 2026: Amazon $200B, Microsoft $190B, Alphabet $180-190B, and Meta $125-145B. * This spending is holding up a K-shaped market. AI infrastructure stocks are surging while other industries, like software and financials, have dropped…
Video analysis: AMZN
All videos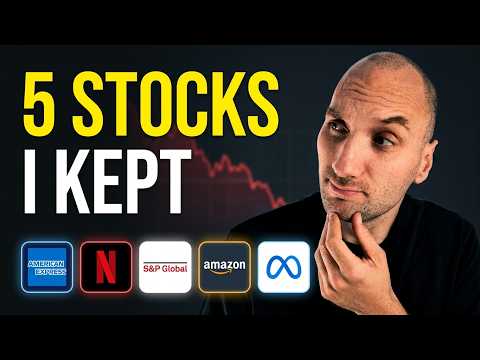
5 Stocks I Refused to Sell(One is up 30%)
I sold 80% of my stock portfolio to pay off my bank loans, but I refused to sell 5 stocks: Meta, Amazon, S&P Global, Netflix and American Express. In this video I explain why each one stayed and why I think all five are still undervalued in 2026.

How To Use Return On Invested Capital (ROIC) To Find Compounders
This video shows you how to use return on invested capital on any stock in three checks. First, whether ROIC even applies to the business, because the metric is useless on banks, REITs and unprofitable companies, and it gets wildly inflated on asset-light software. Second, what a good ROIC ratio actually looks like, and why 10% is not good when most large companies pay 8-12% for their capital. Third, whether the company can repeat it, which is the check that separates a business that compounds from one that just got bigger.
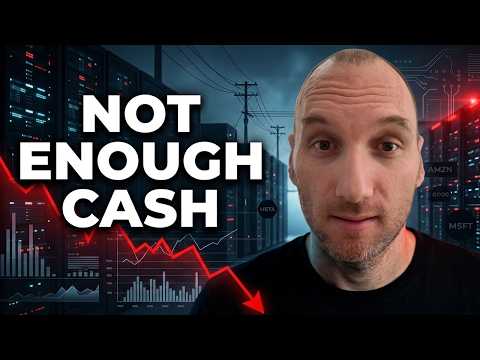
Hyperscalers CapEx Is The Most Important Metric
Hyperscalers ($GOOGL,$AMZN, $MSFT,$META) are stretching balance sheets for AI infrastructure, with Morgan Stanley forecasting $1T+ CapEx by 2027. We break down: • Why Alphabet ($GOOGL) paused share buybacks and pushed debt past $100B despite 82% Cloud growth. • How Amazon ($AMZN) added $57B in long-term debt in one quarter to fund AWS data centers. • Why Microsoft ($MSFT) is down 21% as CapEx drags down Return on Invested Capital (ROIC). • Meta's ($META) pivot to renting excess compute power through Meta Compute. • Power grid limitations: 34GW demands, nuclear/utility deals (Vistra, Oklo), and state-level data center bans. • What happens to AI supply chain stocks like Micron ($MU), Marvell ($MRVL), and Credo ($CRDO) if spending slows.
Want a deeper dive on this stock? Request a new video analysis from our team.


