What Is a Good ROIC for a Company?
TL;DR
- A good ROIC is above 12%. Above 15% is considered strong.
- What counts as good depends on the cost of capital. Most large companies pay 8% to 12%, so a 10% return is standing still.
- A high return only matters if the company still has somewhere to reinvest. 20% with a runway beats 40% without one.
- ROIC says nothing useful about banks, REITs or pre-profit companies. Check the business type before you read the number.
- One year tells you nothing. Read the ten-year trend, and expect dips during heavy capital spending
A good ROIC is above 12%. Above 15%, held for five years or more, is considered strong, and anything under 8% destroys value as the company grows. The more useful answer is that a good return on invested capital beats what that company pays for its own capital (WACC).
A high return on its own is half of what I look for. The other half is whether the company has somewhere left to put the money. A business earning 20% that keeps reinvesting at 20% compounds hard over a decade. A business earning 40% with nowhere left to spend doesn't compound.
ROIC also doesn't apply to every company. For a retailer opening stores it is close to the most important number on the page. For a bank it describes nothing at all. Most of this post is about telling those cases apart.
What each ROIC range means
| ROIC | What it usually means |
|---|---|
| Below 8% | Value destroying. Growth shrinks the business. |
| 8–12% | Average. Covers the cost of capital, not much more. |
| 12–15% | Solid. Real efficiency and some pricing power. |
| 15%+ | Strong, if the company has held it for five years or more. |
| 40%+ | Check the capital base before you believe it. |
One year at any of these levels tells you almost nothing. The pattern over five to ten years carries the information.
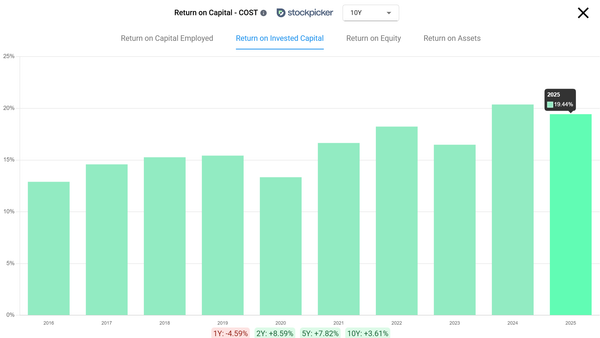
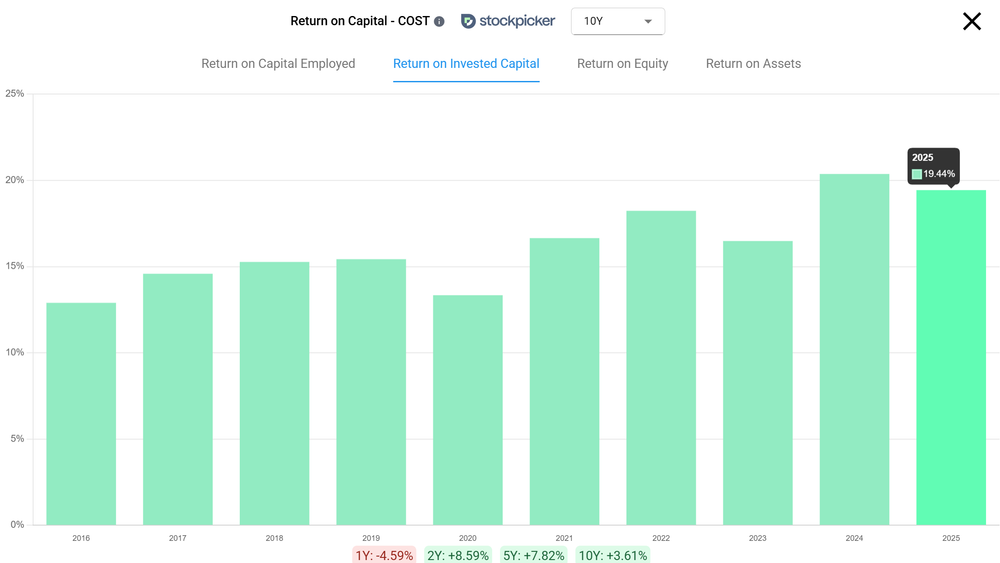
Costco shows what the top band looks like in practice. Its return on invested capital sat near 13% in 2016. By 2025 it reached 19.44%. It climbed through the decade instead of spiking once, with dips in 2020 and 2023 that both recovered. A steady climb like that says more than any single year can.
What is a good return on invested capital?
A good return on invested capital clears the company's cost of capital by a visible margin. For most businesses that means 12% or higher. The size of the gap matters more than the headline number. A 12% return in a business that pays 9% for capital compounds. The same 12% in a business paying 12% produces nothing for shareholders, however fast revenue grows.
Is a ROIC of 10% good?
A ROIC of 10% is average, not good. It clears a typical cost of capital by a point or two. Thin spreads like that vanish when a business hits a bad year or a rate cycle turns. Context changes the reading as well. A regulated utility earning 10% on a huge capital base is doing its job. A software company earning 10% is doing something wrong.
What is a bad ROIC?
Anything below the company's cost of capital is bad. In practice that means anything under 8%, year after year. At that level the business destroys value as it grows, because every dollar it reinvests comes back as less than a dollar. A falling ROIC is worse news than a low one. A company whose return on capital slid from 16% to 4% over a decade has lost its competitive position.
How do you calculate return on invested capital?
Return on invested capital is net operating profit after taxes divided by invested capital. Invested capital is debt plus equity minus cash.
In plain language: you buy a bakery chain for $1,000,000. You put in $600,000 of your own money and borrow $400,000. After flour, wages, electricity and taxes (but before any interest on the loan) it clears $150,000 in the year. Your ROIC is 15%. The metric ignores the fact that some of the money came from a bank, and that is the whole reason to use it.
Which companies does ROIC actually matter for?
ROIC matters most for businesses whose main job is deciding where to put capital. It matters least for two groups: companies that carry almost no capital, and companies that treat capital as raw material.
| Business type | ROIC? | What to use |
|---|---|---|
| Capital-intensive reinvestors | Yes | ROIC over 10 years |
| Mature compounders | Yes | ROIC against the cost of capital |
| Serial acquirers | Yes | The ROIC trend, not the level |
| Banks and insurers | No | ROE and ROA |
| Pre-profit companies | No | Cash burn and runway |
| Asset-light software | Weakly | Reinvestment runway |
| REITs | No | FFO, AFFO, cap rates |
A retailer or restaurant chain opening locations
ROIC fits this case better than any other. Every new store is a capital allocation decision. The return on capital tells you whether store number 900 earns as much as store number 300 did. That question decides whether the expansion story is real.
I watch for ROIC drifting down while the store count climbs. It usually means the good locations are gone and the company is opening worse ones to keep the growth rate up. One adjustment matters here. Businesses that rent their footprint look more efficient than they are, unless the dataset counts operating leases as debt. A chain with heavy lease obligations will show a better number than it deserves.
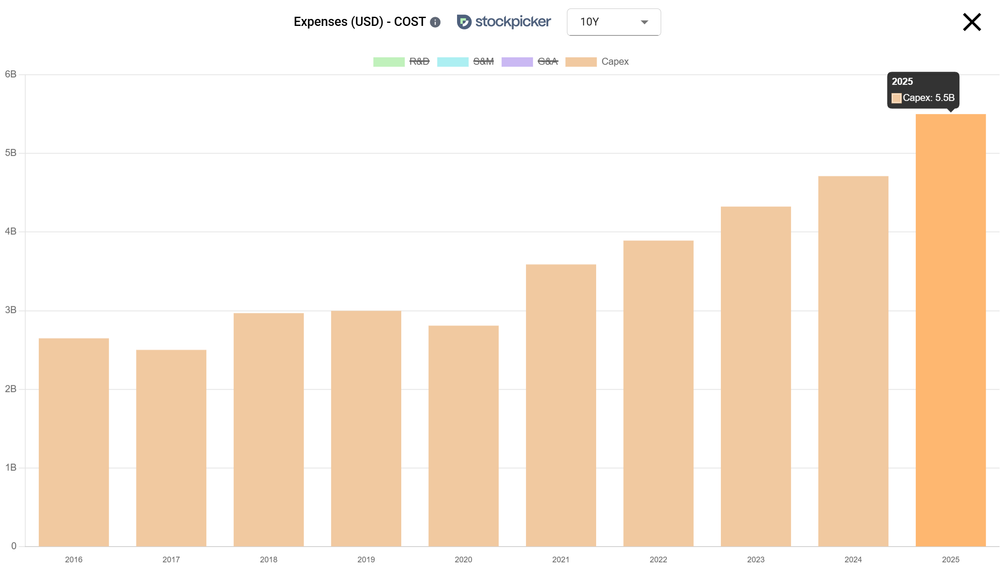
Costco is the version where this went right. Its capital spending roughly doubled over the last decade and reached $5.5bn in 2025. The return on invested capital rose over the same period. The company put far more money to work each year and still earned a higher rate on the total. That combination is rarer than the number of companies claiming an expansion story would suggest.
A serial acquirer
ROIC is the best early warning I know of for a company overpaying for acquisitions. Goodwill from each deal lands in the invested capital base straight away. The profit those deals promised shows up later, or not at all. So the return on capital starts sliding years before anyone takes a write-down.
The trend matters more than the level here. A serial acquirer whose ROIC has fallen from 14% to 9% across six deals is telling you the deals are not working. The adjusted earnings presentation will say otherwise.
A company in the middle of a capex cycle
Here a falling ROIC can mean the opposite of what it usually means. Heavy spending lands in the capital base straight away. The profit from that spending arrives two or three years later. So the ratio dips during the build-out phase even when the investment is a good one.
I separate a build-out from a decline by looking at previous capex cycles at the same company. Did the return on capital recover to its old level the last two times the company spent heavily? Then a current dip is likely timing. Did it step down and stay down after each cycle? Then the business is getting worse at converting capital, and the dip is real.
An asset-light software or payments business
Here the number inflates past the point of being useful. A company that needs almost no invested capital can print a ROIC above 100%. That comes from a tiny denominator. It is not evidence that the business is three times better than one at 35%.
For these companies the useful question is not how high the return is. It is whether there is anywhere left to deploy capital at that rate. In software that is rarer than the headline number suggests.
A company already earning 20% or more
Finding a high return on capital is the easy part. The real work is arguing why it survives. High returns attract competition by definition. A business earning 25% advertises to every rival and every private equity fund that there is money in that industry. In capital-intensive sectors this is close to a law, and the damage is severe. A company whose return on capital falls from 25% to 10% has done more than become less profitable. It has moved from a business worth owning to an average one, and the share price follows.
So when I see a long run of high returns, I try to name the thing stopping competitors from copying it. Scale rivals cannot match, switching costs that make leaving painful, a brand people pay more for, or a regulatory position that is hard to get. If I cannot name it, I treat the high number as temporary.
One caveat applies to everything above. Return on capital describes money the company has already spent. You are buying the next ten years, not the last ten. The history matters only to the extent it tells you something about what comes next.
Why does ROIC not apply to banks?
For a bank, debt is the raw material rather than the financing. Deposits are the inventory a bank buys and resells as loans. Put deposits in the denominator and you get a number that describes nothing. For banks and insurers, return on equity and return on assets tell you something.
What is WACC, and why must ROIC be greater than it?
WACC is the blended cost of the money a company uses, weighted by how much comes from debt and how much from shareholders. The debt half is close to observable. You can see what the company pays in interest and adjust for the tax deduction. The equity half is an estimate of the return shareholders want for taking the risk. No one can look that up. Two analysts can land a couple of points apart on the same company.
ROIC has to clear WACC because WACC is what the capital cost. A company earning 11% on money that cost 9% produces a real surplus. A company earning 11% on money that cost 11% ran a large operation for a year and produced nothing for the people who funded it.
I treat WACC as a band rather than a figure. Most large, stable companies land between 8% and 12%. Smaller or more volatile ones sit higher. Chasing a precise number to two decimals gives false accuracy to an estimate. This is also why I want a visible gap rather than a narrow one. A 1% spread can come from somebody's assumptions. A 6% spread is hard to argue away.
What happens if ROIC is less than WACC?
Growth destroys shareholder value instead of creating it. Every new store, factory or acquisition returns less than it consumed. This catches people out, because a company in that position can post rising revenue and rising reported profit for years while the shares lose value.
How to check a company's ROIC in two minutes
Here is the whole process on Costco stock. In Stockpicker I can see the full picture.
Does the metric apply? Costco is a warehouse retailer that owns much of its property and opens new locations every year. Capital allocation is the business. ROIC applies, so I keep reading. Had this been a bank or a REIT, I would have switched to the return on equity or return on assets tab and stopped.
Is the level any good? 19.44% in 2025. That sits in the top band, above the 15% line.
Has it held? The return was near 13% in 2016, so the ten-year trend is up, not down. Dips in 2020 and 2023 both recovered. This is a company that climbed into the top band and stayed there, which is more convincing than one strong year.
What about the recent drop? The return fell from 20.37% in 2024 to 19.44% in 2025, and on its own that looks like the start of a decline. So I check capital spending in the same year, and it hit a record $5.5bn. The money went into the ground and has not started earning yet. A company spending record amounts while holding a return near 20% is telling me it still has good places to put money, which is what I want to see.
Now do the same check on Walmart. Broadly the same industry, a very different capital base, and I would not want to guess the answer before looking. Both charts in this post came from Stockpicker, and you can pull the same ten-year history for Walmart or any of the stocks you hold. There is no credit card required for your free trial.
Full disclosure: I am not a licensed financial advisor and nothing here is investment advice. This is my own research, I might be missing something, and you should do your own work before buying or selling anything.