AI Analysis
Generated: 7 weeks ago. (Likely Outdated!)
Microsoft Corporation (MSFT) is a technology giant that makes money by selling a wide range of software, cloud services, and hardware. Think of them as a company that provides the digital tools and infrastructure that power businesses and individuals around the world.
1. The Business Model (How They Make Money)
Microsoft's core economic engine is built on a diverse portfolio of products and services, primarily driven by recurring revenue from subscriptions and cloud computing. They essentially operate in three main areas:
- Intelligent Cloud: This is Microsoft's biggest money-maker. It includes their powerful cloud computing platform, Azure, which provides businesses with computing power, storage, and various online services. It also covers server products like SQL Server and Windows Server, as well as development tools like GitHub. In fiscal year 2026, this segment, specifically "Server Products and Cloud Services," generated $129.43 billion in revenue, accounting for nearly 40% of their total business. Azure alone surpassed $100 billion in annual revenue for the first time in fiscal year 2026.
- Productivity and Business Processes: This segment focuses on tools that help people and businesses get work done. It includes popular products like Microsoft 365 (which contains Word, Excel, PowerPoint, and Outlook), LinkedIn (the professional networking site), and Dynamics (business applications for things like customer relationship management). "Microsoft 365 Commercial Products and Cloud Services" brought in $102.00 billion in revenue in fiscal year 2026, representing 30.74% of their total revenue. LinkedIn contributed $19.82 billion.
- More Personal Computing: This part of the business includes products you might use every day, such as the Windows operating system for computers, Xbox gaming consoles and services, Surface devices, and search advertising (Bing). In fiscal year 2026, Xbox generated $21.79 billion, and Windows contributed $17.08 billion to the company's revenue.
Overall, Microsoft's total revenue for fiscal year 2026 was $331.8 billion, an 18% increase from the previous year. For fiscal year 2025, their total revenue was $281.7 billion.
2. The Metrics That Matter Most
For a company like Microsoft, which is a leader in cloud services and software, these five metrics give us the clearest picture of its financial health:
- Revenue: This is the total amount of money Microsoft brings in from selling its products and services before any expenses are taken out. For a company with diverse offerings like Microsoft, consistently growing revenue shows that their products are in high demand and they are expanding their market reach. Microsoft's revenue was $331.8 billion in fiscal year 2026, up from $281.7 billion in fiscal year 2025.
- Net Income: This is Microsoft's profit after all expenses, including taxes, have been paid. It tells us how much money the company truly earned. A growing net income indicates that Microsoft is not only selling more but also managing its costs effectively. Microsoft's net income was $133.7 billion in fiscal year 2026, compared to $101.8 billion in fiscal year 2025.
- Free Cash Flow (for FY2026) / Operating Cash Flow (for FY2025):
- Free Cash Flow (for FY2026): This is the cash a company generates after paying for its operating expenses and capital expenditures (like building new data centers). It's the money left over that can be used for things like paying down debt, buying back shares, or issuing dividends. For a tech company investing heavily in cloud infrastructure, strong free cash flow shows it can fund its growth and still reward shareholders. Microsoft generated $67.0 billion in free cash flow in fiscal year 2026.
- Operating Cash Flow (for FY2025): This represents the cash generated purely from a company's regular business operations before accounting for investments or financing activities. It's a good indicator of the health of the core business. Microsoft's cash from operations was $136.2 billion in fiscal year 2025.
- R&D Expenses (Research & Development Expenses): This metric shows how much money Microsoft is investing in creating new products, improving existing ones, and exploring new technologies like artificial intelligence. For a technology company, high and consistent R&D spending is crucial for staying competitive and driving future growth. Microsoft spent $35.6 billion on research and development in fiscal year 2026, an increase from $32.5 billion in fiscal year 2025.
- Operating Margin: This percentage tells us how much profit Microsoft makes from each dollar of sales after covering its direct costs and operating expenses (like salaries and marketing), but before accounting for taxes and interest. A healthy and improving operating margin indicates that the company is managing its operations efficiently. Microsoft's operating margin was 46.8% in fiscal year 2026, up from 44.73% in fiscal year 2025.
3. How to Value This Company
The most relevant valuation metric for Microsoft is the P/E Ratio (Price-to-Earnings Ratio).
- What it is: The P/E ratio compares a company's current stock price to its earnings per share (how much profit it makes for each share of stock).
- Why it matters for Microsoft: Microsoft is a large, established, and consistently profitable company with a history of strong earnings growth, especially driven by its cloud and software businesses. The P/E ratio is a widely understood and effective way to see if investors are paying a reasonable price for those earnings.
- How to use it: To figure out if Microsoft's stock is cheap or expensive, you would compare its current P/E ratio to its historical P/E ratios, as well as to the P/E ratios of similar large, growing technology companies. If Microsoft's P/E ratio is higher than its historical average or its peers, it might suggest investors expect faster future growth, or that the stock is relatively more expensive. If it's lower, it could indicate the opposite. For example, Microsoft's trailing P/E ratio was 26.91 as of July 2026. You would then compare this to its past performance and competitors to make an informed decision.
⚠️ Disclaimer: This analysis is generated by AI. stockpicker.tech is not responsible for any mistakes, inaccuracies, or hallucinations. This is for educational purposes only and does not constitute financial advice. Users should always double-check the information and conduct their own research before making investment decisions.
Log in to generate a MOAT report for this stock.
Log in to generate an earnings report for this stock.
Log in to generate an operating leverage report for this stock.
Log in to generate a management report for this stock.
Log in to generate a valuation report for this stock.
Microsoft Corporation

Analysis: MSFT
All analysis
Fiscal.ai Review 2026: Pricing, Features & Alternative
Fiscal.ai is one of the most capable research platforms available to investors today. It pulls earnings call transcripts, segment-level KPIs, analyst estimates, filings and an AI assistant into one place, runs on institutional data, and covers over 100,000 companies globally. It does things most research products do…
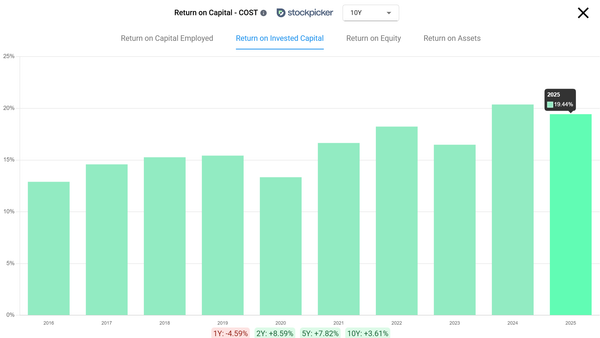
What Is a Good ROIC for a Company?
TL;DR * A good ROIC is above 12%. Above 15% is considered strong. * What counts as good depends on the cost of capital. Most large companies pay 8% to 12%, so a 10% return is standing still. * A high return only matters if the company still has somewhere to reinvest. 20% with a runway beats 40% without one. * ROIC…
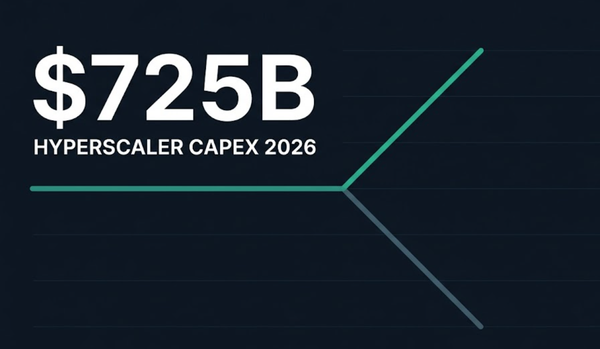
Hyperscaler CapEx Is the Only Metric That Matters Right Now
TL;DR: * The four largest hyperscalers are set to spend roughly $725 billion on capex in 2026: Amazon $200B, Microsoft $190B, Alphabet $180-190B, and Meta $125-145B. * This spending is holding up a K-shaped market. AI infrastructure stocks are surging while other industries, like software and financials, have dropped…
Video analysis: MSFT
All videos
How To Use Return On Invested Capital (ROIC) To Find Compounders
This video shows you how to use return on invested capital on any stock in three checks. First, whether ROIC even applies to the business, because the metric is useless on banks, REITs and unprofitable companies, and it gets wildly inflated on asset-light software. Second, what a good ROIC ratio actually looks like, and why 10% is not good when most large companies pay 8-12% for their capital. Third, whether the company can repeat it, which is the check that separates a business that compounds from one that just got bigger.

Hyperscalers CapEx Is The Most Important Metric
Hyperscalers ($GOOGL,$AMZN, $MSFT,$META) are stretching balance sheets for AI infrastructure, with Morgan Stanley forecasting $1T+ CapEx by 2027. We break down: • Why Alphabet ($GOOGL) paused share buybacks and pushed debt past $100B despite 82% Cloud growth. • How Amazon ($AMZN) added $57B in long-term debt in one quarter to fund AWS data centers. • Why Microsoft ($MSFT) is down 21% as CapEx drags down Return on Invested Capital (ROIC). • Meta's ($META) pivot to renting excess compute power through Meta Compute. • Power grid limitations: 34GW demands, nuclear/utility deals (Vistra, Oklo), and state-level data center bans. • What happens to AI supply chain stocks like Micron ($MU), Marvell ($MRVL), and Credo ($CRDO) if spending slows.
Want a deeper dive on this stock? Request a new video analysis from our team.
News: MSFT
Similar companies
-
 Oracle Corporation
ORCL
·
New York Stock Exchange
Compare
Oracle Corporation
ORCL
·
New York Stock Exchange
Compare
-
 International Business Machines Corporation
IBM
·
New York Stock Exchange
Compare
International Business Machines Corporation
IBM
·
New York Stock Exchange
Compare
-
 SAP SE
SAP
·
New York Stock Exchange
Compare
SAP SE
SAP
·
New York Stock Exchange
Compare
-
 Adobe Inc.
ADBE
·
NASDAQ
Compare
Adobe Inc.
ADBE
·
NASDAQ
Compare
-
 Salesforce, Inc.
CRM
·
New York Stock Exchange
Compare
Salesforce, Inc.
CRM
·
New York Stock Exchange
Compare
-
 ServiceNow, Inc.
NOW
·
New York Stock Exchange
Compare
ServiceNow, Inc.
NOW
·
New York Stock Exchange
Compare