Fiscal.ai Review 2026: Pricing, Features & Alternative

Fiscal.ai is one of the most capable research platforms available to investors today. It pulls earnings call transcripts, segment-level KPIs, analyst estimates, filings and an AI assistant into one place, runs on institutional data, and covers over 100,000 companies globally. It does things most research products do not. It was built as FinChat.io and rebranded to Fiscal.ai in 2025.
This Fiscal.ai review covers the platform in full and recommends it outright for several use cases. Fiscal.ai is a good fit for:
- Professional investors, analysts and portfolio managers who research full-time
- Anyone tracking company-specific KPIs, segment by segment
- Investors who want an AI assistant that answers from verified financial data, not a general model's memory
- Developers and power users connecting the data to ChatGPT or Claude through the API and MCP
Fiscal.ai is a poor fit for:
- Investors on a budget, where $470 a year is a large share of what they put to work
- Anyone who does not read earnings calls or track segment-level KPIs company by company
- Investors focused on long-term financial trends over daily research depth
- Anyone who prefers a cleaner, simpler interface over a dense professional terminal
- Investors who want to save time, with plain questions answered by AI and every fundamental already charted, instead of a terminal they configure themselves
If that describes your process, the best alternative is Stockpicker. It covers most of what Fiscal.ai does for fundamentals research, gives up to 40 years of financial history, spans 13,000+ global equities, and costs $10 a month. The Fiscal.ai walkthrough below is a fair one, and I recommend them outright for the use cases above.
What is Fiscal.ai?
Fiscal.ai is a web-based investment research terminal that combines institutional financial data with a conversational AI layer. It rebranded from FinChat.io in 2025, and the AI assistant sits on top of a licensed data feed, not a general model, which is what lets it answer with verified figures.

Fundamentals, ratios and estimates come from a combination of their own data feed and S&P Global Market Intelligence. The segment and KPI data is proprietary, pulled directly from company filings. Coverage runs to more than 100,000 companies globally, plus ETFs and funds.
Fiscal.ai suits the investor who treats research as a full-time or near-daily activity: someone who reads calls, tracks operating metrics quarter to quarter, and wants filings, transcripts, estimates and financials in one place instead of five tabs.
Fiscal.ai pros and cons
| Pros | Cons |
|---|---|
| Segment and KPI data most research products do not have | Financial history is capped by plan (15 / 20+ years) |
| Transcripts, audio, slides and filings in one place | The cheaper plan already runs $470 a year |
| Institutional data sources (S&P Global Market Intelligence) | No free plan, only a 7-day trial that needs a card |
| Coverage of 100,000+ companies globally | Full data export sits on the $79 tier |
| AI screener you can describe in plain English | Dense interface with a real learning curve |
| API and MCP access for developers | Priced above most retail research budgets |
How Fiscal.ai works and its key features
Segments and KPIs: the feature that made the platform
This is the sharpest thing Fiscal.ai does. Instead of showing consolidated revenue and stopping there, it breaks a company into the segments and operating metrics management actually discusses on the call. The data is proprietary, taken from filings, and covers 2,100+ companies.
AI Copilot: plain-English questions, verified answers
You ask questions in normal language and it pulls the answer straight from the underlying financials, which is the point of putting AI on top of a licensed data feed. It is a genuinely useful way to get to a figure fast.
Earnings transcripts and filings: the research time saver
Full transcripts, call audio, slide decks and filings aggregated per company. If reading calls is part of how you decide, this is genuinely useful and it is one of the clearest reasons to pay.
Stock screener with AI filters
You can describe what you are looking for in plain English and it builds the criteria, or you can use structured filters across hundreds of metrics. Both work well.
Dashboards, brokerage sync and advanced charts
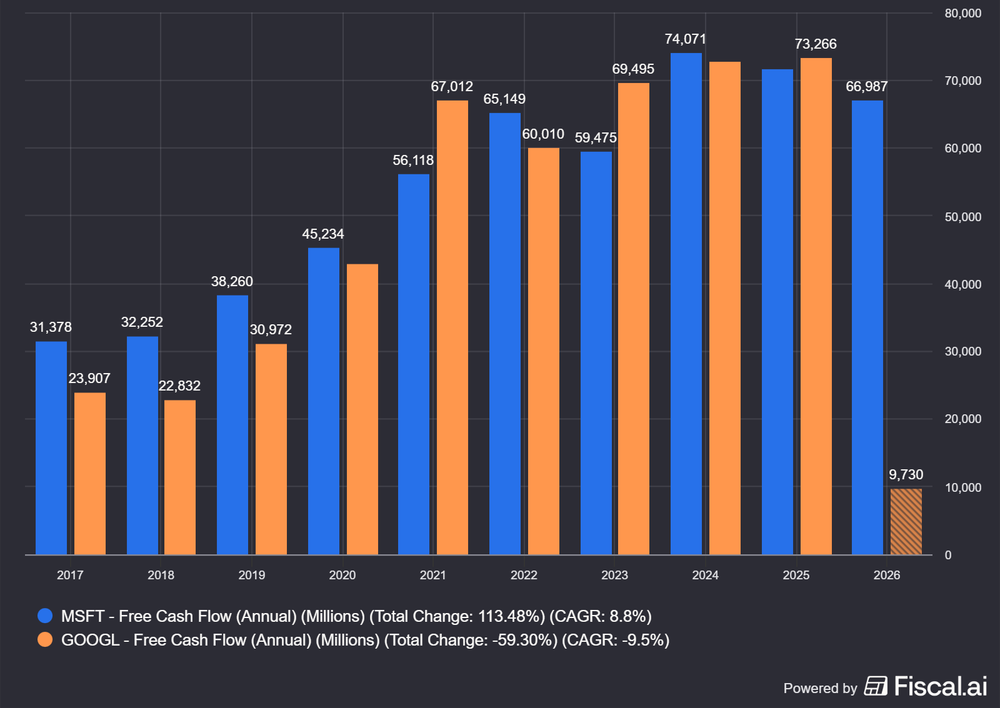
Paid plans connect to brokerage accounts and let you build dashboards from any metric in the system. You can also chart several companies side by side on the same metric, which is useful for peer comparison.
API and MCP for developers
There is a separate API and MCP product that pipes the same data into your own tools, priced through their sales team instead of listed publicly. This is one of the most differentiated things they sell.
How much does Fiscal.ai cost?
Fiscal.ai costs $39 a month for Pro (billed annually, or $49 month to month) and $79 a month for Max ($99 month to month). Both start with a 7-day free trial that requires payment details and auto-renews into the paid plan unless you cancel before it ends.
Fiscal.ai Pricing Plans 2026
| Pro | Max | |
|---|---|---|
| Price | $39/mo annual, $49 monthly | $79/mo annual, $99 monthly |
| Annual financials | 15 years | 20+ years |
| Segment and KPI history | 10 years | 15+ years |
| Dashboards | 10 | Unlimited |
| Company coverage | 100,000+ | 100,000+ |
| AI summaries | Custom, plus equity research feed | Custom, plus full data export |
| Brokerage sync | Yes | Yes |
(Pricing and tier limits checked August 2026. Verify on their site before subscribing.)
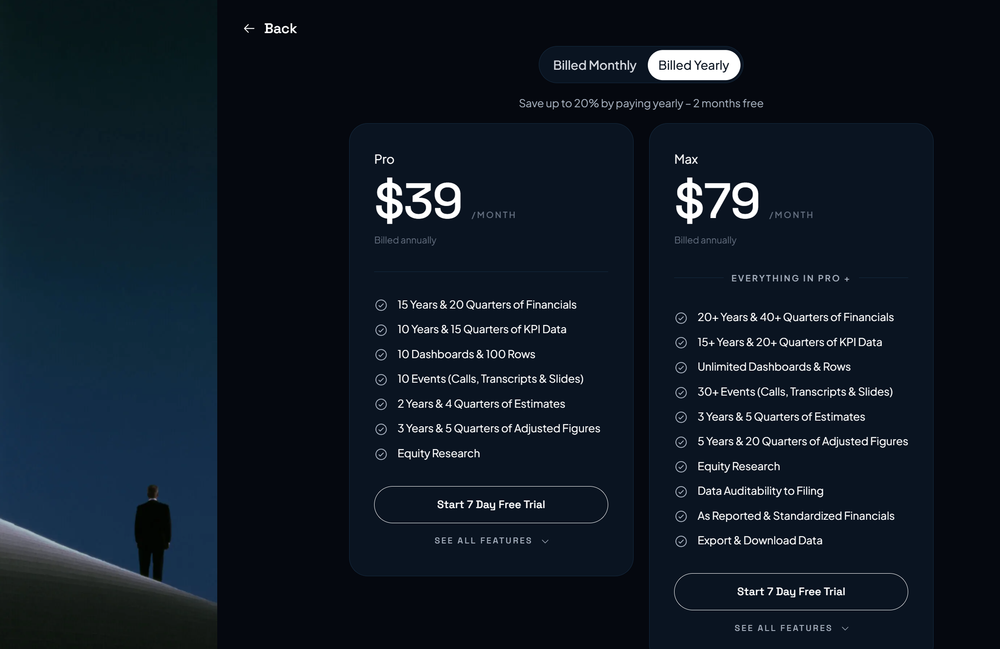
There is no permanent free version. The only way in without paying is the 7-day trial, and because it asks for a card up front and renews automatically, it is worth setting a reminder if you are only testing.
Is Fiscal.ai worth the price for a retail investor?
Fiscal.ai does not fall short at what it does. The question is whether what it does is worth $470 a year for how a self-directed investor actually researches, and if there are viable alternatives for less.
History is a paid feature, and it has a ceiling. Fifteen years on Pro, twenty-plus on Max. The number of years of financials you can see is a function of what you pay, and even the top plan tops out around twenty. Fifteen years on Pro covers 2011 onward, which means you cannot see how a company handled 2008. For a bank, an industrial or anything cyclical, that is the period you most want to look at.
The depth is priced for a professional workload. The transcripts, the segment KPIs and the AI allowance are worth $39 a month if you read every earnings call and track operating metrics quarter to quarter. If you are a retail investor, you are paying professional pricing for a professional cadence you may not run.
What is the best alternative to Fiscal.ai?
The best alternative to Fiscal.ai is Stockpicker. It covers most of what Fiscal.ai does for fundamentals research, at a fraction of the price. Where Fiscal.ai is built for full-time professionals, Stockpicker gives a self-directed investor the same core research without the terminal's cost or complexity.
The focus is deliberately on the fundamentals question: has this business gotten better or worse over time, and is the current price reasonable given its own history. Is the revenue growing? Does the company have pricing power?
Up to 40 years of history
Where the history exists, you get it, and it does not change when you upgrade. Microsoft goes back to 1986. A company that listed two years ago has two years, but nothing is held back behind a higher plan.
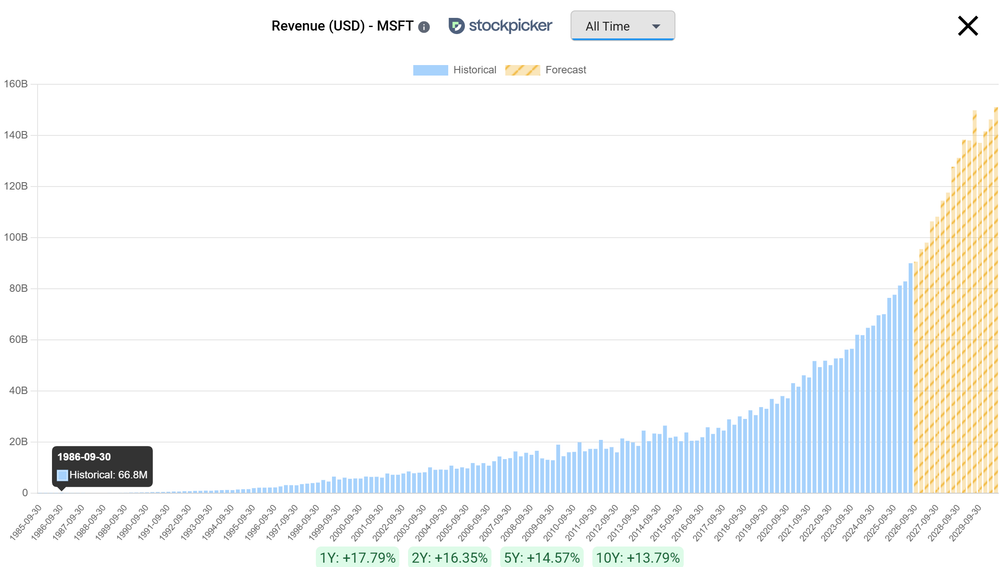
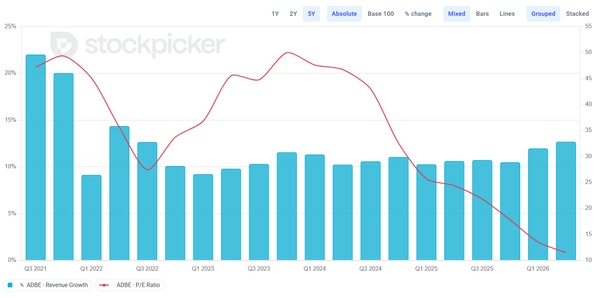
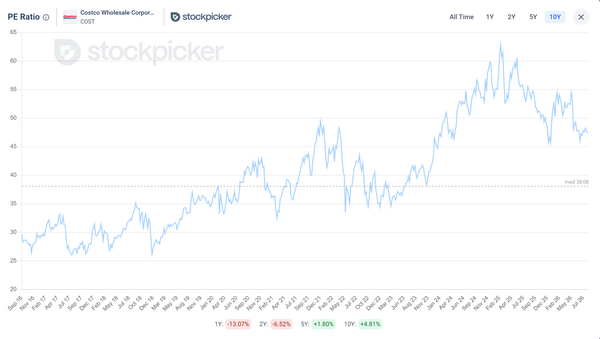
You get revenue, net and operating income, gross and operating margins, free cash flow, operating cash flow, share buybacks, P/OCF, EV/EBITDA, ROCE, historical and forward P/E, debt ratios, dividend yield and more, all as interactive charts you can read at a glance instead of tables you have to interpret yourself.
The Stockpicker Comparison Tool
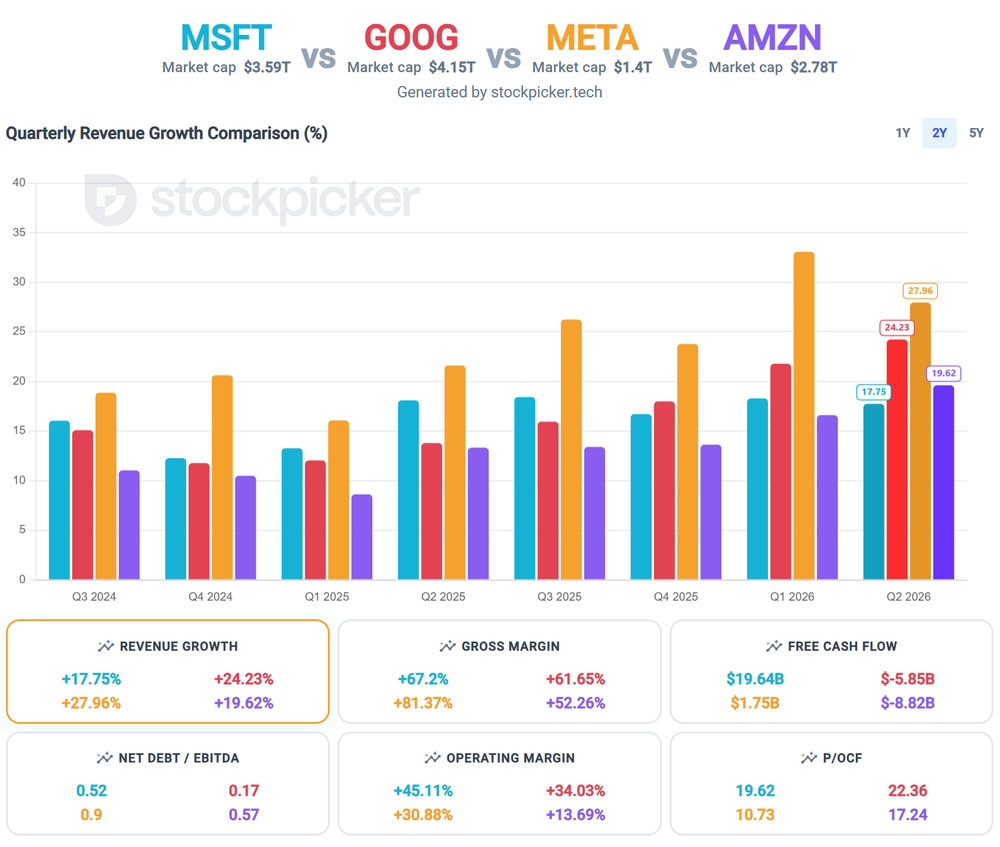
The Stockpicker Comparison Tool puts up to four companies side by side on six metrics over up to five years. You choose which six from the platform's full set, including FCF, revenue growth, gross margin, P/E, EV/EBITDA, P/OCF and more.
A number in isolation tells you very little until you see it next to its peers and next to its own history. You can also export any comparison as a shareable snapshot.
AI analysis on every ticker page
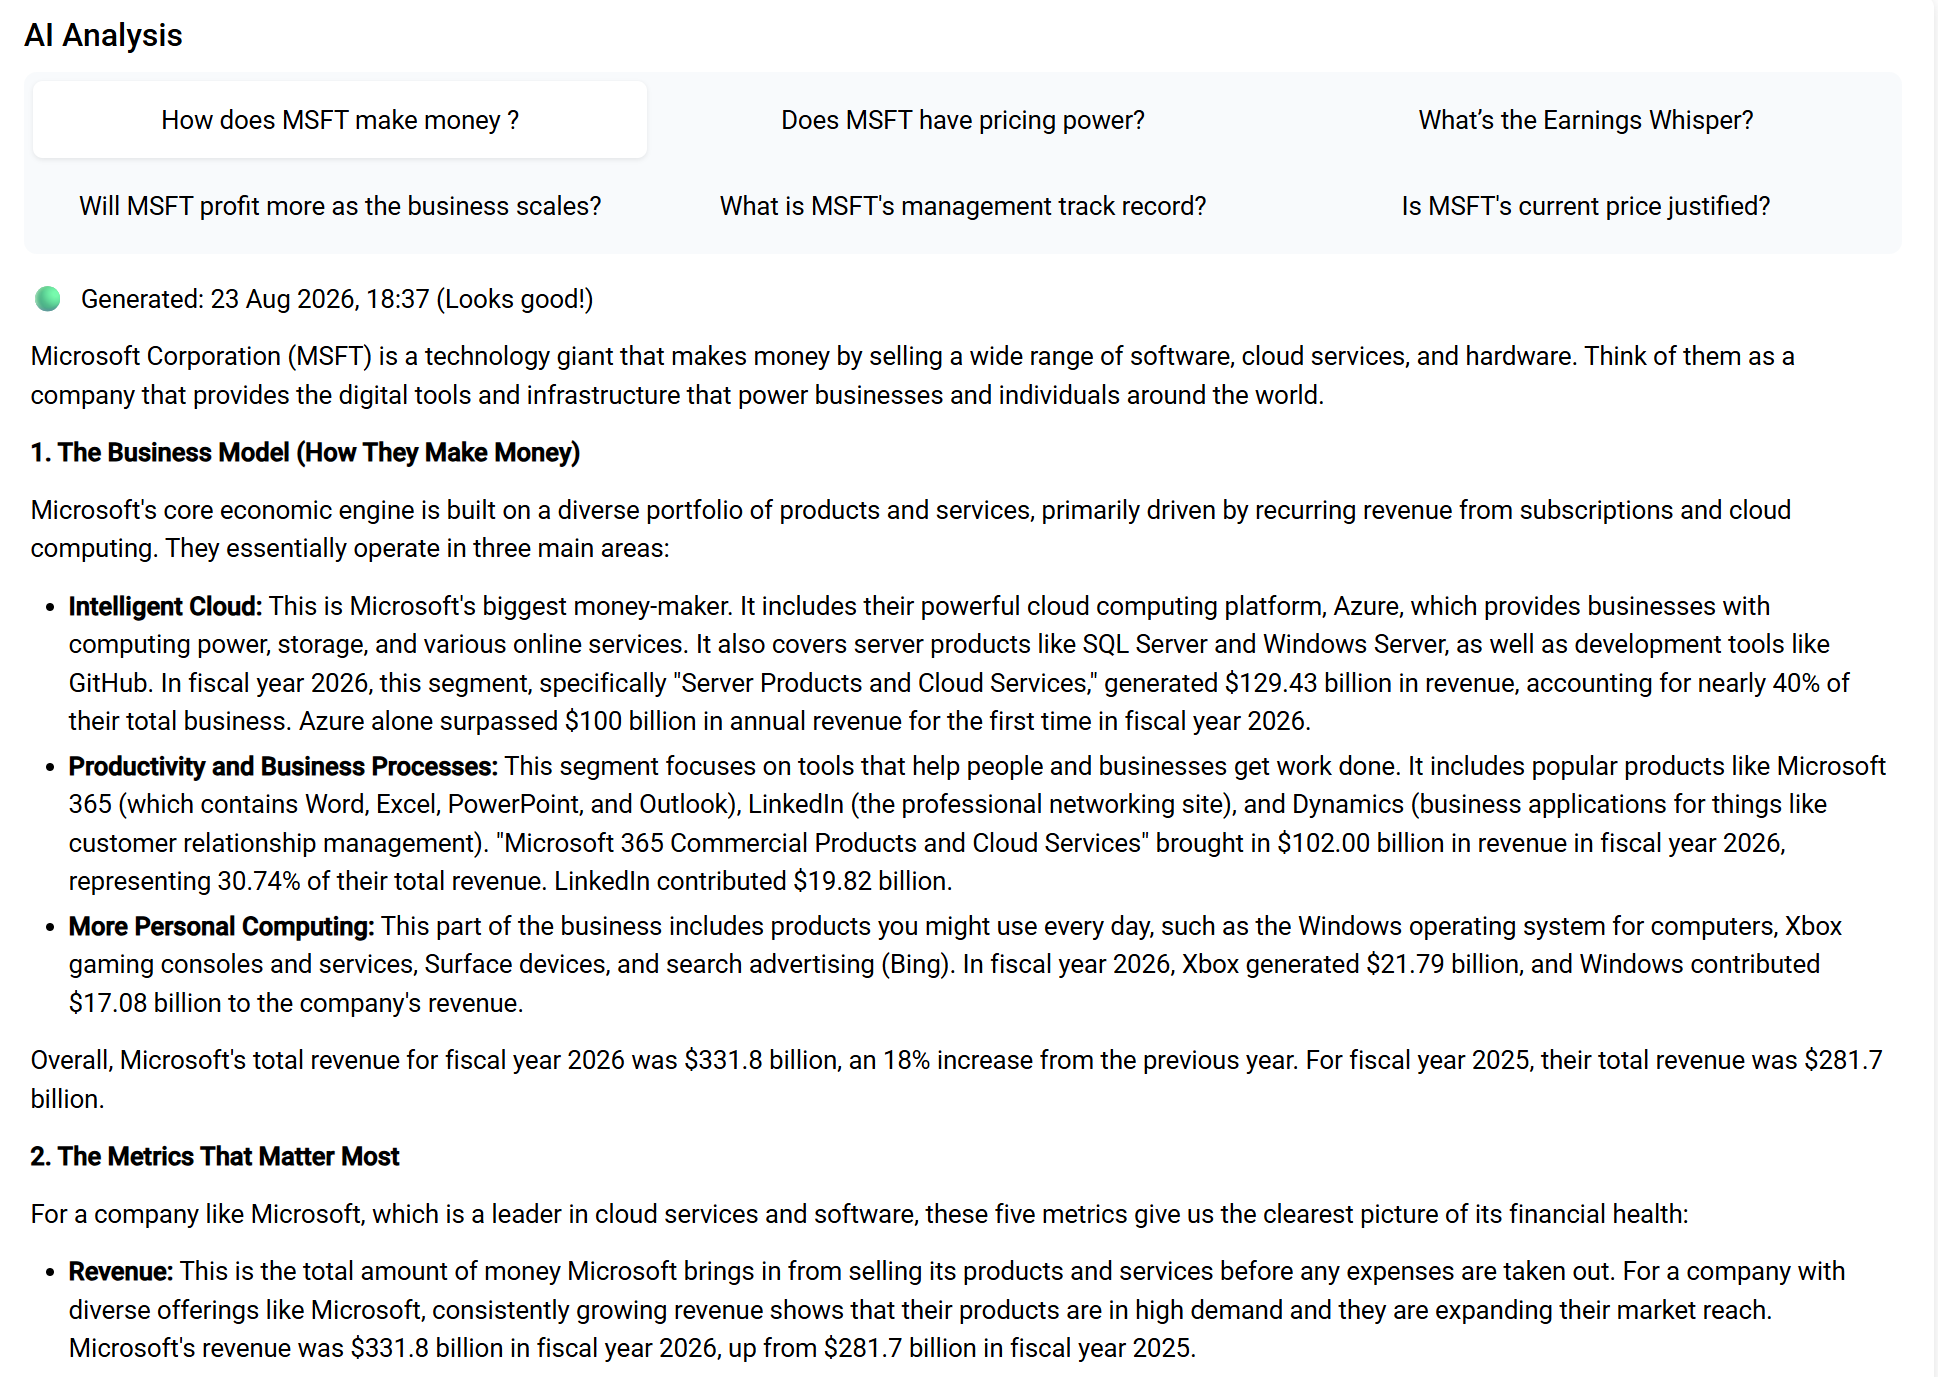
Every ticker page runs AI analysis that answers the questions investors actually ask: how does this company make money, does it have pricing power, is the current price justified. It is grounded in the company's own data, not a general chat window.
Stockpicker Pricing
There is a permanent free tier and a 7-day trial that does not ask for a card. Paid plans are $10 a month for standard and $20 a month for pro. The history depth does not change between them, only the AI credits do.
Fiscal.ai or Stockpicker: comparison summary
| Aspect | Fiscal.ai | Stockpicker |
|---|---|---|
| Entry paid price | $39/mo annual, $49 monthly | $10/mo, $20/mo pro |
| Financial history | 15 / 20+ years, tiered by plan | Up to 40 years on every plan |
| Free access | 7-day trial, card required | Permanent free tier, plus 7-day trial with no card |
| Coverage | 100,000+ companies, ETFs and funds | 13,000+ global equities |
| Fundamentals and ratios | Yes, full set | Yes, full set as interactive charts |
| AI analysis | Copilot chat you drive with prompts | Answers the common questions per ticker (pricing power, is the price justified) |
| Company comparison | Screener, dashboards and metric charting | Comparison Tool, up to 4 stocks on 6 metrics over 5 years |
| Segment and KPI data | Yes, 2,100+ companies | Not included |
| Earnings transcripts | Yes, with audio and slides | Not included |
| Brokerage sync and API | Yes on paid plans, API priced separately | Not included |
| Best for | Full-time and professional research | Fundamentals research at an affordable price |
Final verdict
Choose Fiscal.ai if research is a daily, professional part of your work and you want the full terminal. Transcripts, segment KPIs, brokerage sync, wide global coverage and the API are all real capabilities built for that kind of process.
Choose Stockpicker if you want to judge a company's fundamentals without a terminal's price or learning curve. It pulls the numbers that show whether a business is getting stronger and whether the price is fair, presented cleanly enough to read at any experience level. You get more years of history for a quarter of the price.
There is also the cost itself. The gap between the two is $29 a month, and for an investor on a budget that money arguably does more inside the market than on a subscription. Put that $29 a month into your portfolio instead, and at a 10% annual return (roughly the long-run market average) it would grow to about $5,546 over ten years. That is not the only reason to pick one over the other, but it is a fair thing to weigh when the more affordable option already answers your main questions.
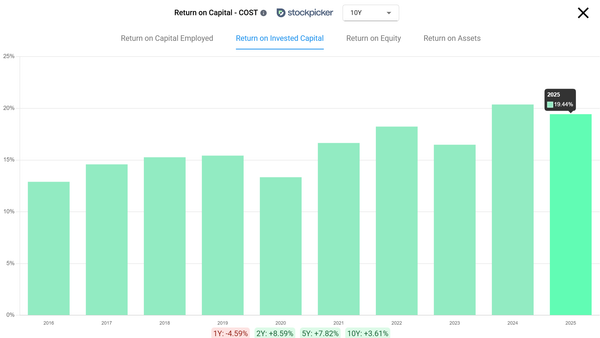
Long story short, Fiscal.ai is an excellent platform, and a lot of what you pay for is granular detail: the exact number of warehouses Costco operates, say, broken out quarter by quarter. That is good to have, but it is not what tells you whether Costco is a great business. Growing revenue, durable margins, steady free cash flow and high returns on invested capital do that, and you can see all of them on Stockpicker for a fraction of the price. If you want a wider view of what else is out there, I compared the research platforms I rate most separately.
Disclaimer: This article is for informational purposes only and does not constitute financial advice. Fiscal.ai pricing and features were checked in August 2026 and may have changed since.f