AI Analysis
Generated: 3 weeks ago. (Likely Outdated!)
Meta Platforms, Inc. (Ticker: META) is a technology giant that connects billions of people worldwide through its social media platforms and is actively building the next generation of digital experiences.
The Business Model (How They Make Money)
Meta Platforms primarily makes its money by selling advertising space on its popular social media platforms. Think of it like a television network selling ad slots during popular shows, but on a much more personalized and global scale. The company operates through two main parts:
- Family of Apps (FoA): This is Meta's core money-maker. It includes widely used platforms like Facebook, Instagram, Messenger, and WhatsApp. Businesses pay Meta to show their ads to specific groups of users across these apps. The more people use these apps and the more engaging the content, the more opportunities Meta has to show ads and earn revenue. In 2025, the Family of Apps segment generated $198.76 billion in revenue, accounting for 98.9% of Meta's total revenue. This strong performance continued into the second quarter of 2026, with Family of Apps ad revenue reaching $59.4 billion, a 27% increase from the previous year. This growth was driven by a 14% increase in the number of ads shown and a 12% increase in the average price Meta charged for each ad.
- Reality Labs (RL): This segment is Meta's bet on the future, focusing on virtual and augmented reality technologies. It includes products like VR headsets and the development of the "metaverse," an immersive digital world. While this segment is crucial for Meta's long-term vision, it currently generates a much smaller portion of the company's income. In 2025, Reality Labs brought in $2.21 billion in revenue, representing just 1.1% of Meta's total revenue. This segment is in a heavy investment phase, meaning it costs a lot to develop these new technologies, and its operating losses are expected to remain similar to 2025 levels in 2026.
Essentially, Meta uses the massive cash generated by its advertising business to fund its ambitious long-term projects in virtual and augmented reality and artificial intelligence.
The Metrics That Matter Most
For Meta, keeping an eye on these four metrics will give you a clear picture of its financial health and future prospects:
- Revenue: This is the total amount of money Meta brings in from all its activities, primarily advertising. For a company like Meta that thrives on growth and expanding its reach, a consistently increasing revenue figure shows that its core business is attracting more users and advertisers. In the second quarter of 2026, Meta reported $60.80 billion in revenue, a 28% increase year-over-year. For the full year 2025, total revenue was $200.97 billion, up 22% from 2024.
- Operating Income: This metric tells you how much profit Meta makes from its main business operations before accounting for things like interest payments and taxes. It's particularly important for Meta because it helps you understand the profitability of its dominant advertising business, even as the company invests heavily in its less profitable Reality Labs segment. A strong operating income indicates that the core business is robust enough to support these future-focused investments. Meta's operating income for the second quarter of 2026 was $18.78 billion. For the full year 2025, income from operations was $83.28 billion.
- Free Cash Flow: This is the cash a company has left over after paying for its day-to-day operations and all its major investments, such as building new data centers or developing new technologies. It's a crucial indicator of a company's financial strength and its ability to fund growth, pay down debt, or return money to shareholders. Given Meta's massive spending on AI and the metaverse, tracking free cash flow shows if these ambitious investments are sustainable and if the company is still generating substantial cash. In Q2 2026, Meta's free cash flow was $784 million. For the full year 2025, free cash flow was $43.59 billion.
- Capital Expenditures (CapEx): This metric represents the money Meta spends on buying, maintaining, or improving its physical assets, such as data centers, servers, and other infrastructure. For Meta, CapEx is a direct measure of its aggressive investment in building out its AI capabilities and the metaverse. High CapEx signals the company's commitment to future growth, but also highlights the significant costs involved in these long-term projects. In Q2 2026, capital expenditures were $31.08 billion. Meta anticipates 2026 capital expenditures to be in the range of $130 billion to $145 billion.
How to Value This Company
The most relevant valuation metric for Meta Platforms is EV/EBITDA (Enterprise Value to Earnings Before Interest, Taxes, Depreciation, and Amortization).
Here's why: Meta is a company making huge investments in physical assets like data centers and advanced computing infrastructure for AI and the metaverse. These investments lead to significant depreciation expenses on their financial statements. EV/EBITDA is a great tool because it helps you look at the company's core operating profitability without the distortions that can come from different accounting choices for depreciation or varying levels of debt.
In simple terms, EV/EBITDA compares the total value of the entire company (its "Enterprise Value," which includes its stock market value, plus its debt, minus its cash) to its operating earnings before taking out interest, taxes, and those big non-cash expenses like depreciation and amortization. This gives you a clearer, more "apples-to-apples" way to compare Meta's operational value to other companies, especially those also making large capital investments, helping you decide if the stock is cheap or expensive based on its underlying business performance.
⚠️ Disclaimer: This analysis is generated by AI. stockpicker.tech is not responsible for any mistakes, inaccuracies, or hallucinations. This is for educational purposes only and does not constitute financial advice. Users should always double-check the information and conduct their own research before making investment decisions.
Log in to generate a MOAT report for this stock.
Log in to generate an earnings report for this stock.
Log in to generate an operating leverage report for this stock.
Log in to generate a management report for this stock.
Log in to generate a valuation report for this stock.
Meta Platforms, Inc.

Analysis: META
All analysis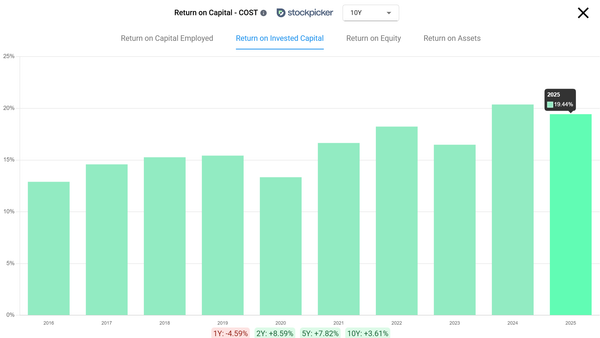
What Is a Good ROIC for a Company?
TL;DR * A good ROIC is above 12%. Above 15% is considered strong. * What counts as good depends on the cost of capital. Most large companies pay 8% to 12%, so a 10% return is standing still. * A high return only matters if the company still has somewhere to reinvest. 20% with a runway beats 40% without one. * ROIC…
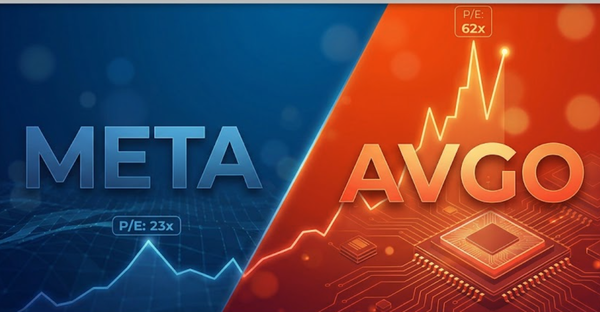
Meta vs Broadcom, Why Broadcom Is Worth More Than Meta?
Meta and Broadcom have similar market caps, with Broadcom valued around 12% higher at $1.82T against META's $1.63T. A dollar is a dollar, so it is important to know what underlying business you are buying for a similar valuation. I ran both companies through the Stockpicker Comparison Tool and here are the raw…
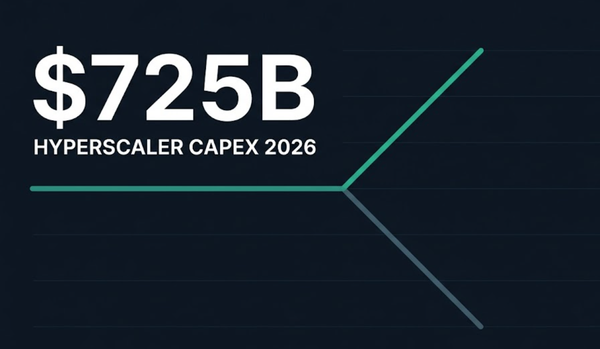
Hyperscaler CapEx Is the Only Metric That Matters Right Now
TL;DR: * The four largest hyperscalers are set to spend roughly $725 billion on capex in 2026: Amazon $200B, Microsoft $190B, Alphabet $180-190B, and Meta $125-145B. * This spending is holding up a K-shaped market. AI infrastructure stocks are surging while other industries, like software and financials, have dropped…
Video analysis: META
All videos
RDDT Stock: Is Reddit Down 35% for the Wrong Reason?
In this Reddit stock analysis, I explain how Reddit makes money and why it captures both Google's search intent and Meta's browsing intent. People come to Reddit with a question before they buy something, and around 40% of conversations on the platform are about what to buy. That makes Reddit a performance marketing platform, not just a social network.
5 Stocks I Refused to Sell(One is up 30%)
I sold 80% of my stock portfolio to pay off my bank loans, but I refused to sell 5 stocks: Meta, Amazon, S&P Global, Netflix and American Express. In this video I explain why each one stayed and why I think all five are still undervalued in 2026.

How To Use Return On Invested Capital (ROIC) To Find Compounders
This video shows you how to use return on invested capital on any stock in three checks. First, whether ROIC even applies to the business, because the metric is useless on banks, REITs and unprofitable companies, and it gets wildly inflated on asset-light software. Second, what a good ROIC ratio actually looks like, and why 10% is not good when most large companies pay 8-12% for their capital. Third, whether the company can repeat it, which is the check that separates a business that compounds from one that just got bigger.
Want a deeper dive on this stock? Request a new video analysis from our team.


