AI Analysis
Generated: 2 weeks ago. (Likely Outdated!)
Alphabet Inc. (Ticker: GOOG) is a technology giant whose business model is built on providing a wide array of internet-related services and products, primarily generating revenue through advertising. The company's core strength lies in its ability to connect users with information and businesses with customers on a massive scale.
The Business Model (How They Make Money)
Alphabet's economic engine is primarily fueled by digital advertising, which is integrated across its popular platforms. They essentially offer free services to billions of users, like search (Google Search) and video sharing (YouTube), and then sell ad space to businesses looking to reach those users.
Here's a breakdown of their main revenue streams:
- Google Services: This is the largest part of Alphabet's business, encompassing products like Google Search, YouTube, Android, Chrome, and Google Maps. The vast majority of revenue in this segment comes from advertising. In fiscal year 2025, Google Search & Other generated $224.53 billion, representing 55.72% of Alphabet's total revenue. YouTube ads contributed $40.37 billion in 2025. For the first quarter of 2026, Google Services revenue increased to $89.6 billion.
- Google Cloud: This segment provides cloud computing services to businesses, including infrastructure, platform capabilities, and industry-specific solutions. It's a rapidly growing area for Alphabet. In fiscal year 2025, Google Cloud generated $58.71 billion in revenue. This growth accelerated significantly, with Google Cloud revenues increasing to $20.0 billion in Q1 2026 and further to $24.8 billion in Q2 2026.
- Other Bets: This segment includes Alphabet's newer, more experimental ventures like Waymo (self-driving technology) and Verily (life sciences). While these businesses hold long-term potential, they currently represent a very small portion of total revenue and often operate at a loss as they are in development stages. In fiscal year 2025, Other Bets generated $1.54 billion in revenue, accounting for 0.38% of total revenue.
Overall, Alphabet's total revenue for fiscal year 2025 was $402.83 billion. The company's trailing twelve-month (TTM) revenue as of 2026 reached $445.86 billion.
The Metrics That Matter Most
For a company like Alphabet, which thrives on innovation, user engagement, and digital services, here are the most important financial pulses to check:
- Revenue: This metric simply tells you the total amount of money the company brings in from selling its products and services before any expenses are taken out. For Alphabet, a growing revenue number shows that more people are using their search engine, watching YouTube, or signing up for Google Cloud, which means their core businesses are expanding and reaching more customers. Alphabet's revenue for 2025 was $402.83 billion, and its trailing twelve-month revenue for 2026 was $445.86 billion, indicating continued growth.
- Operating Income: This figure shows how much profit the company makes from its regular business operations after covering the costs directly related to running those operations, but before accounting for things like interest payments or taxes. It's a good measure of how efficient Alphabet is at turning its sales into profit from its main activities. For Q1 2026, Alphabet's operating income increased 30% to $39.696 billion, with an operating margin of 36.1%. In Q2 2026, the operating margin was 34%.
- Net Income: This is the "bottom line" profit, representing the total money the company has left after all expenses, including taxes and interest, have been paid. It's the ultimate measure of a company's profitability. Alphabet reported an annual net income of $132.17 billion in 2025. In Q1 2026, net income increased by 81%, and in Q2 2026, it saw a significant increase of 298%.
- CapEx (Capital Expenditures): This metric represents the money a company spends to buy, maintain, or improve its physical assets, like buildings, equipment, or technology infrastructure. For Alphabet, especially with its heavy investment in AI and cloud services, CapEx is crucial. It shows how much they are investing in the infrastructure needed to support their growing services and future innovations. Alphabet plans to invest around $180 billion in total CapEx in 2026, which is double the $90 billion from the previous year. In Q2 2026, CapEx nearly doubled to $44.9 billion.
- EPS (Earnings Per Share): This is the portion of a company's profit allocated to each outstanding share of common stock. It's a widely used indicator of a company's profitability on a per-share basis, making it easy for investors to compare the earnings power of different companies. Alphabet's EPS for 2025 was $10.81. For Q1 2026, EPS was $5.11, and for Q2 2026, it was $9.11.
How to Value This Company
The most relevant valuation metric for Alphabet is the P/E ratio (Price-to-Earnings ratio).
The P/E ratio helps you figure out if a stock is cheap or expensive by comparing its current stock price to how much profit the company makes per share. You calculate it by taking the stock's current price and dividing it by the company's earnings per share (EPS).
Here's why it's the best for Alphabet: Alphabet is a consistently profitable and growing company. The P/E ratio is a straightforward way to see how much investors are willing to pay for each dollar of Alphabet's earnings. If the P/E ratio is high, it generally means investors expect higher earnings growth in the future. If it's lower, it might suggest slower growth expectations or that the stock is undervalued compared to its earnings. For Q2 2026, Alphabet had a trailing EPS of $19.91 and a P/E ratio of 17.11. By comparing Alphabet's P/E ratio to its historical P/E, or to the P/E ratios of similar large, profitable tech companies, you can get a sense of whether its stock is currently trading at a reasonable price based on its ability to generate profits.
⚠️ Disclaimer: This analysis is generated by AI. stockpicker.tech is not responsible for any mistakes, inaccuracies, or hallucinations. This is for educational purposes only and does not constitute financial advice. Users should always double-check the information and conduct their own research before making investment decisions.
Log in to generate a MOAT report for this stock.
Log in to generate an earnings report for this stock.
Log in to generate an operating leverage report for this stock.
Log in to generate a management report for this stock.
Log in to generate a valuation report for this stock.
Alphabet Inc.

Analysis: GOOG
All analysis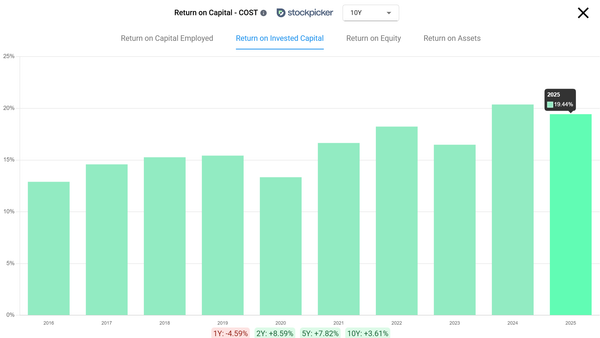
What Is a Good ROIC for a Company?
TL;DR * A good ROIC is above 12%. Above 15% is considered strong. * What counts as good depends on the cost of capital. Most large companies pay 8% to 12%, so a 10% return is standing still. * A high return only matters if the company still has somewhere to reinvest. 20% with a runway beats 40% without one. * ROIC…
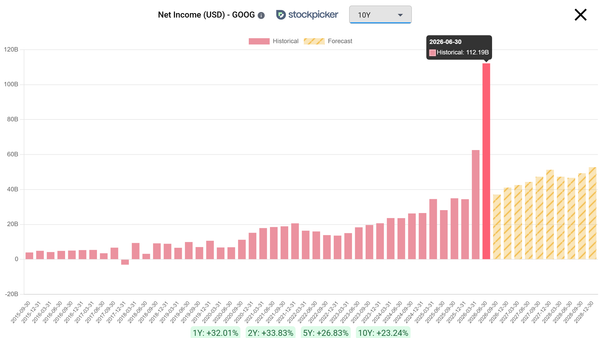
Why is Google P/E so low?
Google's P/E ratio looks unusually low because a one-time accounting gain made its earnings look much bigger than the business actually produced. When earnings jump like that, the P/E ratio drops, even though nothing about the real business got cheaper. Here is what happened. Last quarter Alphabet booked a $98 billion…
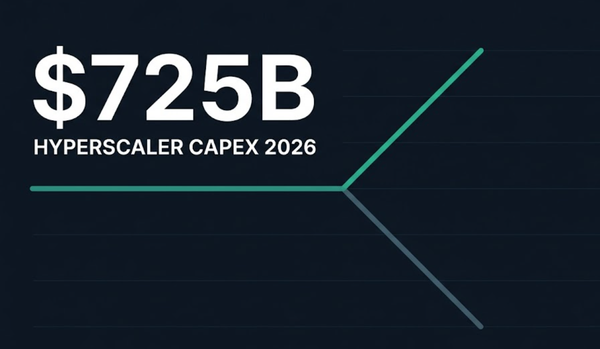
Hyperscaler CapEx Is the Only Metric That Matters Right Now
TL;DR: * The four largest hyperscalers are set to spend roughly $725 billion on capex in 2026: Amazon $200B, Microsoft $190B, Alphabet $180-190B, and Meta $125-145B. * This spending is holding up a K-shaped market. AI infrastructure stocks are surging while other industries, like software and financials, have dropped…
Video analysis: GOOG
All videos
How To Use Return On Invested Capital (ROIC) To Find Compounders
This video shows you how to use return on invested capital on any stock in three checks. First, whether ROIC even applies to the business, because the metric is useless on banks, REITs and unprofitable companies, and it gets wildly inflated on asset-light software. Second, what a good ROIC ratio actually looks like, and why 10% is not good when most large companies pay 8-12% for their capital. Third, whether the company can repeat it, which is the check that separates a business that compounds from one that just got bigger.
Hyperscalers CapEx Is The Most Important Metric
Hyperscalers ($GOOGL,$AMZN, $MSFT,$META) are stretching balance sheets for AI infrastructure, with Morgan Stanley forecasting $1T+ CapEx by 2027. We break down: • Why Alphabet ($GOOGL) paused share buybacks and pushed debt past $100B despite 82% Cloud growth. • How Amazon ($AMZN) added $57B in long-term debt in one quarter to fund AWS data centers. • Why Microsoft ($MSFT) is down 21% as CapEx drags down Return on Invested Capital (ROIC). • Meta's ($META) pivot to renting excess compute power through Meta Compute. • Power grid limitations: 34GW demands, nuclear/utility deals (Vistra, Oklo), and state-level data center bans. • What happens to AI supply chain stocks like Micron ($MU), Marvell ($MRVL), and Credo ($CRDO) if spending slows.
Want a deeper dive on this stock? Request a new video analysis from our team.


