Why is Google P/E so low?
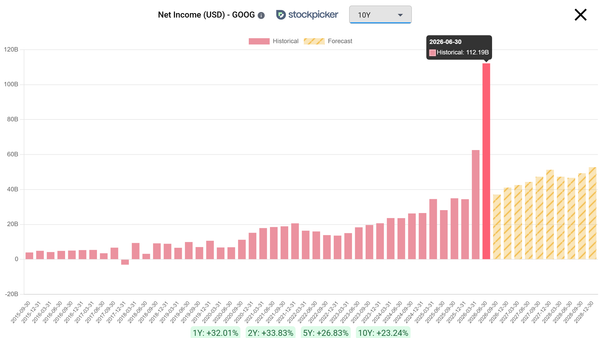
Google's P/E ratio looks unusually low because a one-time accounting gain made its earnings look much bigger than the business actually produced. When earnings jump like that, the P/E ratio drops, even though nothing about the real business got cheaper.
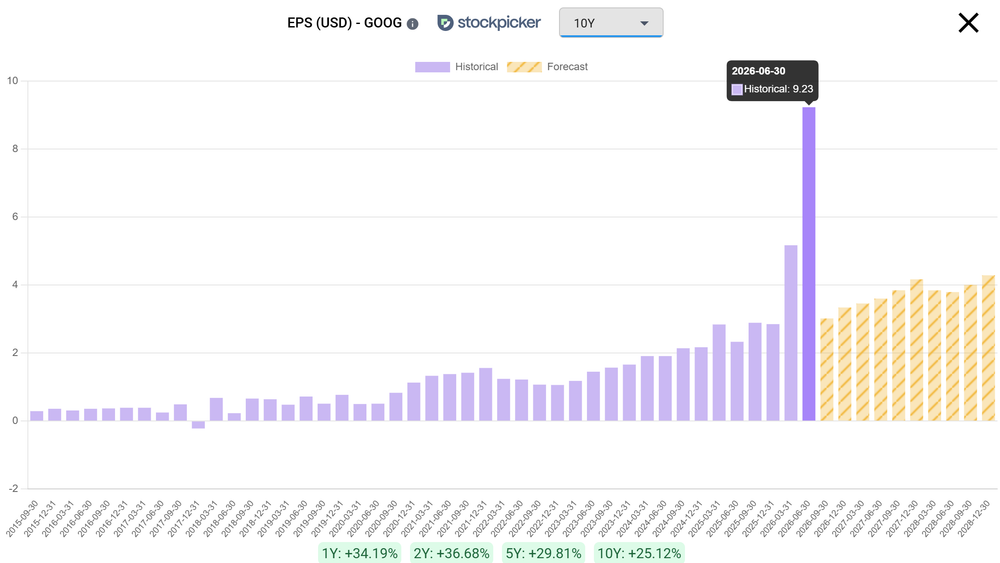
Here is what happened. Last quarter Alphabet booked a $98 billion non-cash gain from its stakes in SpaceX and Anthropic. GAAP accounting rules force the company to add the rising paper value of those investments to its net income, even though Google never sold anything and never collected a dollar of it. That gain pushed reported earnings up, and a higher earnings number pushes the P/E ratio down.
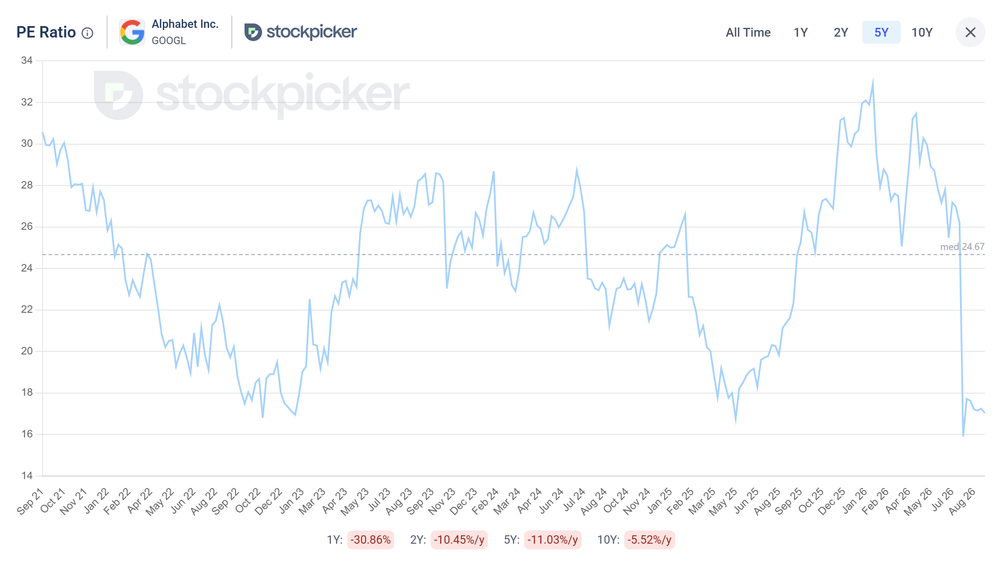
You can see the distortion in a single comparison. GAAP earnings per share came in at $9.23 last quarter. Strip out the one-time investment gain, and adjusted earnings per share was $2.85. The real number is about a third of the headline. The P/E ratio is built on the $9.23 figure, which is why it looks so low.
So the low P/E is not the market pricing Google as cheap. It is an accounting artifact. To value Google properly, you need a metric that this paper gain cannot touch.
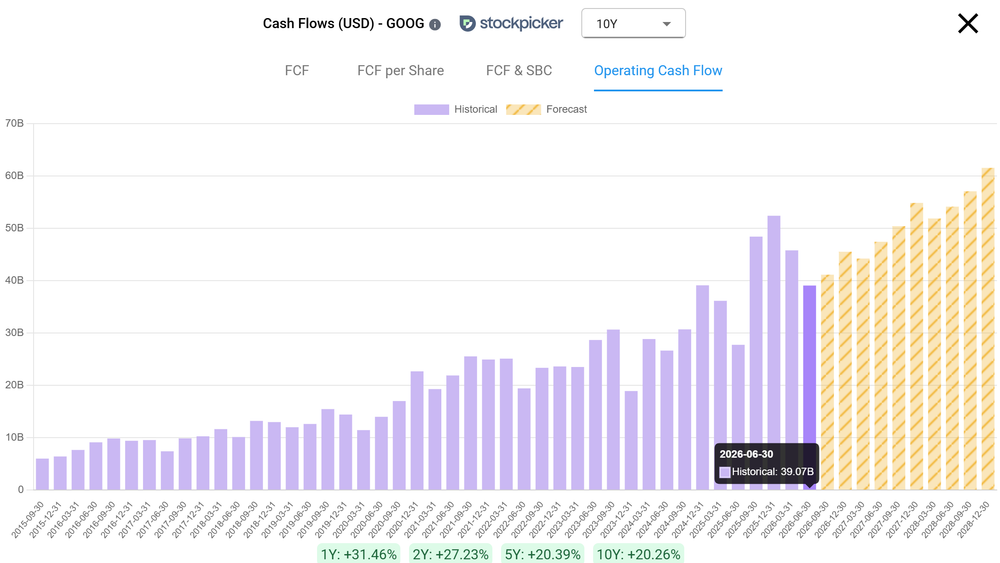
The important metric to follow here is operating cash flow. Google's operating cash flow grew 40% last quarter, which is mainly the result of cloud revenue growth.
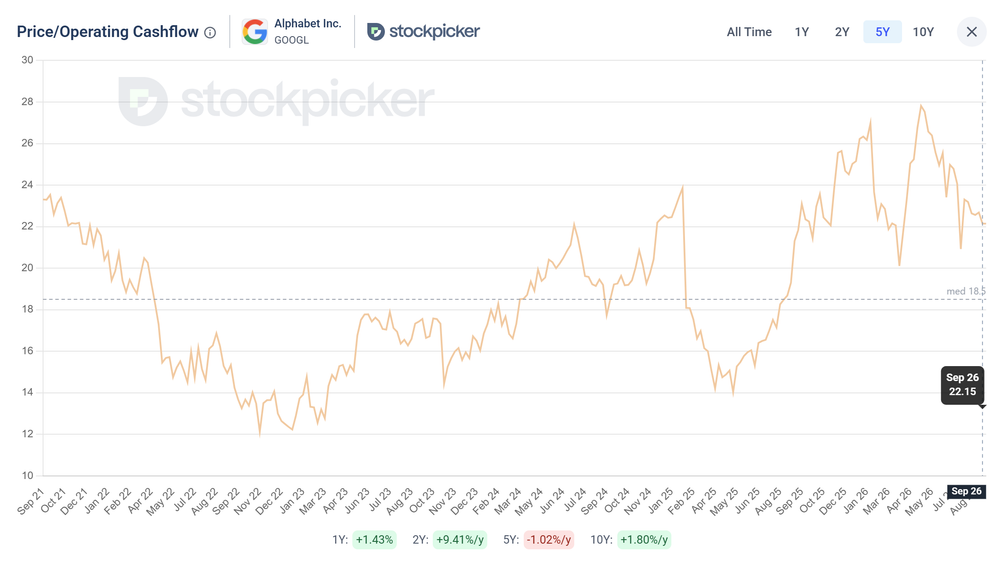
Price to operating cash flow is the relevant valuation metric for Google. It is 22x, and I believe it provides the best look into Google's valuation.
We use operating cash flow instead of free cash flow because of the CapEx spending. Google is expected to invest $200B in CapEx this year, which drags free cash flow down, and it even went negative. This blurs short-term visibility on FCF and makes it inaccurate. Operating cash flow is not directly reduced by CapEx on the cash flow statement and it is the clearest near-term read of the underlying business. With CapEx this large, the next thing to check is what counts as a good return on invested capital, because that spending lands in the capital base immediately while the profit from it arrives years later.
The 40% OCF growth we saw in the chart comes mainly from Google Cloud revenue, which grew 82% last quarter. Google Cloud revenue is obviously affected by the big CapEx investments in cloud data centers.
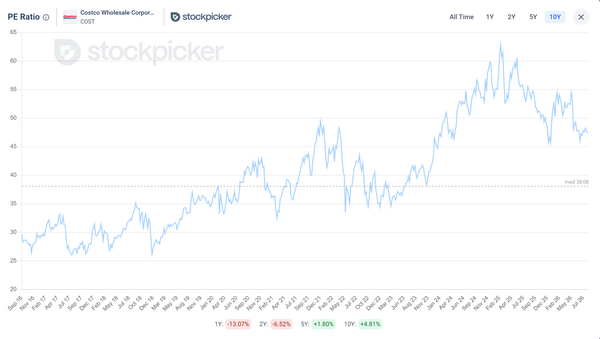
The opposite situation is just as easy to misread. When a P/E looks unusually high, that is not automatically a stock to avoid either. I wrote about why Costco's P/E ratio is so high and what actually justifies the premium.
If you want to track metrics like operating cash flow across a company's full history, Stockpicker is an affordable alternative to the pricey research terminals.
Full disclosure: I own shares of GOOG, and it is my largest position. This post is for informational purposes only, it is not financial advice. Do your own research.