What Is a Good P/E Ratio?
A good P/E depends on how fast the company is growing, how reliable its earnings are, and how its own multiple has behaved in the past. A P/E of 10 can be expensive and a P/E of 40 can be reasonable, depending on the business underneath it.
The P/E ratio is generally affected, positively or negatively, by two important factors:
- Business growth: a higher growth profile commands a premium. If you have two businesses with similar earnings, but one is growing profits 5% while the other is growing 15%, naturally the higher-growth one will command a higher multiple.
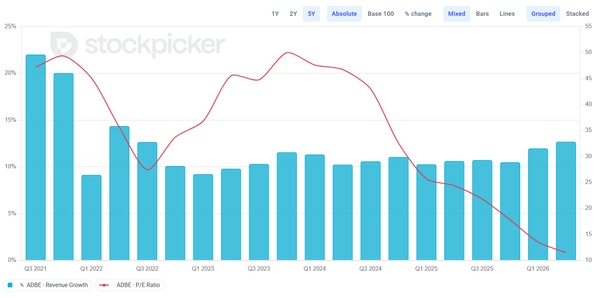
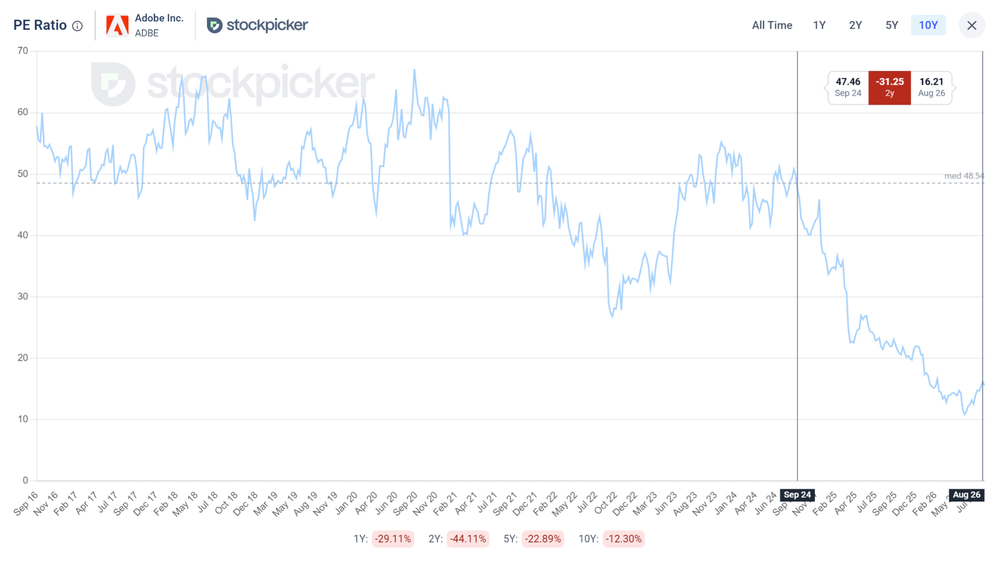
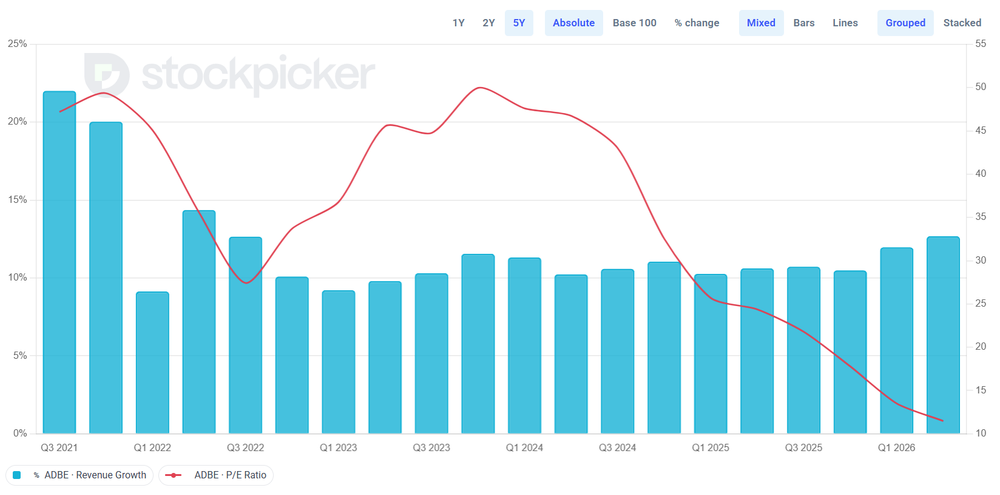
- Media sentiment: sometimes businesses with higher growth profiles trade at low multiples, and vice versa, based on positive or negative media sentiment. Good examples from recent times are Tesla and Adobe. Tesla is trading at 301 times earnings based on hyped expectations for humanoid robots and robotaxis. Adobe is trading at 16x earnings based on fear of AI disrupting SaaS companies.
So the P/E ratio is the price investors are willing to pay for $1 of earnings of this particular company. A P/E of 20 means you are paying $20 for every $1 the company earns in a year. But this number is meaningless if you don't know what to compare it to.
Is a high or low P/E ratio better?
A lower P/E ratio is considered cheaper, while a higher one is considered more expensive. But this is subjective and must be judged company by company, against each one's growth profile.
A low P/E often looks like a bargain and turns out to be a warning. The market prices some companies cheaply because their earnings are expected to shrink, and the low multiple is the market telling you so in advance. Buying purely because the number is low is how people end up in a value trap, holding a stock that keeps falling because the business keeps deteriorating.
A high P/E often looks expensive and turns out to be justified. If a company grows quickly, or its earnings almost never fall, investors will pay more for each dollar of profit because they expect more dollars to come. The multiple is high because the future is worth more than the present.
What matters is whether the number matches the business.
Two real examples where the number lies
The clearest way to see this is two companies whose multiples point in the opposite direction to reality.
Google has traded at a P/E that looks unusually low for a company of its quality, and the low number is misleading rather than a bargain. Here is why Google's P/E is so low.
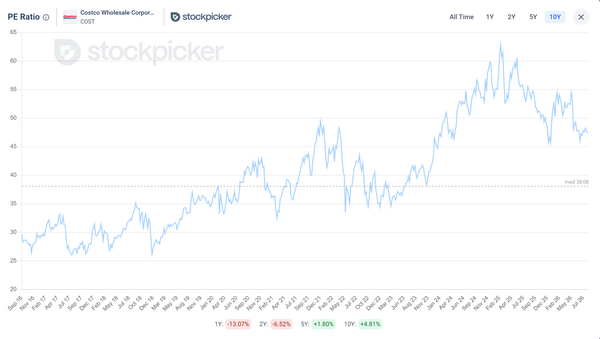
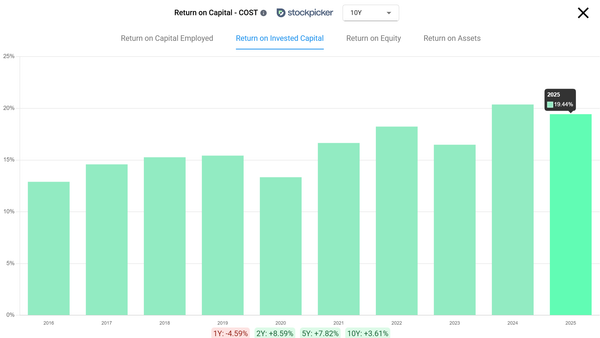
Costco has traded near 47 times earnings, which looks expensive but is largely justified by the business underneath it. Here is why Costco's P/E is so high.
In both cases the raw number gives the wrong answer until you look at the business behind it.
How to interpret a P/E ratio the right way
Interpreting a P/E ratio means putting it in the three contexts that decide whether it is cheap or expensive: the company's own history, its growth rate, and the reliability of its earnings.
The most useful of the three is the company's P/E across its full history, because it shows whether today's multiple is normal, high, or low for that specific business, which the market average can never tell you. Adobe’s P/E of 16x is meaningless until we compare it to the 10 year chart and median of 48x. In the last 2 years it dropped from 47x to 16x while the growth profile of the business didn’t change much.
This is what Stockpicker is built for. It shows the full P/E history for any stock next to the growth and margin trends that explain it, so you can see whether a multiple is justified instead of guessing from a single number.
What is a good P/E ratio for a growth stock?
Growth changes everything about how you read the multiple. A high P/E on a fast grower can be cheaper than a low P/E on a company with flat earnings.
The reason is that earnings compound. Take a company at 20 times earnings growing profits 20% a year. If the price stays flat, next year's earnings are 20% higher, so you are effectively paying about 17 times those earnings, and the year after about 14 times. The multiple you paid falls every year the company grows into it. A company whose earnings are flat gets no such help, so the same 20 times stays 20 times, year after year.
This is why comparing the P/E of a growth company to the P/E of a mature one tells you little. The number has to be read next to the growth rate, not on its own. The formal version of this is the PEG ratio, which divides the P/E by the growth rate to put the two in a single number.
Trailing P/E versus forward P/E
There are two versions of the ratio and they answer different questions.
Trailing P/E uses the earnings the company has already reported over the last twelve months. It is factual and it is what most sites show by default, but it can mislead when something one-off distorted recent earnings, which is exactly what happened with Google.
Forward P/E uses analysts' estimates of next year's earnings instead. It looks ahead, which is often what you actually want, but it depends on forecasts that can be wrong. The honest way to use the two is together: trailing tells you what happened, forward tells you what the market expects, and a large gap between them is worth understanding before you buy.
So what is a good P/E ratio?
A good P/E is one that is reasonable for that specific company's growth, the reliability of its earnings, and its own valuation history. There is no universal cutoff, and any number given as a universal cutoff is wrong.
The practical way to judge any P/E is to stop looking at it alone and put it in context:
- Compare the company to its own P/E history, not just the market average.
- Read the multiple next to the growth rate, because growth changes what counts as expensive.
- Check whether a one-off item distorted recent earnings, which makes trailing P/E unreliable.
- Look at whether the earnings are steady or volatile, because reliable earnings earn a higher multiple.
You can check all four for any stock on Stockpicker, including the full P/E history that tells you whether today's number is high or low for that particular company.
I am not a professional analyst and this is not investment advice. It is a framework for reading one number in context, not a recommendation to buy or sell anything. Do your own research.