AI Analysis
Generated: 4 weeks ago. (Likely Outdated!)
Alphabet Inc. (GOOGL) is a technology giant whose business model is primarily driven by its dominant advertising platforms, complemented by a rapidly expanding cloud computing division and investments in innovative future technologies.
The Business Model (How They Make Money)
Alphabet's core economic engine revolves around connecting users with information and advertisers with those users across its vast ecosystem of products.
- Google Services: This is the largest segment and the primary revenue generator. It includes:
- Google Search & other: When you use Google Search, you see advertisements alongside your search results. Businesses pay Google to display their ads to people actively looking for specific products or services. This segment generated $63.3 billion in revenue in the second quarter of 2026. For the full year 2025, Google Search & Other revenue was $224.53 billion, representing approximately 55.72% of Alphabet's total revenue.
- YouTube ads: Advertisers pay to show commercials and promotional content on YouTube videos. This contributed $11.1 billion to Alphabet's revenue in the second quarter of 2026.
- Google subscriptions, platforms, and devices: This category encompasses revenue from sources like the Google Play Store (app sales and in-app purchases), sales of hardware products (such as Pixel phones and Nest devices), and subscription services like YouTube Premium and Google One. This segment brought in $12.91 billion in the second quarter of 2026.
- Google Cloud: This segment provides cloud computing services to businesses and organizations. Essentially, Alphabet rents out its powerful computing infrastructure, storage, and software tools over the internet. This is a high-growth area for the company, with revenue jumping 82% to $24.8 billion in the second quarter of 2026. In 2025, Google Cloud revenue was $58.71 billion.
- Other Bets: This segment includes Alphabet's more experimental and long-term ventures, such as Waymo (self-driving technology) and Verily (life sciences). While these businesses are currently smaller and often require significant investment, they represent potential future growth engines. In 2025, Other Bets generated $1.54 billion in revenue.
The Metrics That Matter Most
For Alphabet, understanding its financial health and growth trajectory involves looking at these key performance indicators:
- Revenue: This is the total amount of money the company brings in from all its sales before any expenses are deducted. For Alphabet, consistently growing revenue indicates that its core advertising business remains strong, and its newer ventures, especially Google Cloud, are successfully expanding and attracting customers. In the second quarter of 2026, Alphabet's consolidated revenue was $119.8 billion, marking a 24% increase compared to the same period last year. For the full year 2025, total revenue reached $402.8 billion.
- Operating Income: This metric shows how much profit Alphabet makes from its main business activities after covering the costs directly related to running those businesses, like employee salaries, marketing, and research and development, but before accounting for taxes and interest payments. A rising operating income demonstrates that Alphabet's core operations are not only generating sales but are also becoming more efficient and profitable. In the second quarter of 2026, Alphabet's operating income was $40.8 billion, a 30% increase year-over-year.
- R&D Expenses (Research & Development Expenses): As a leading technology company, Alphabet's future success hinges on its ability to innovate. R&D expenses represent the money the company invests in creating new products, improving existing ones, and exploring cutting-edge technologies like artificial intelligence. Significant and sustained R&D spending is crucial for Alphabet to maintain its competitive edge and drive long-term growth. While specific R&D expense figures for Q2 2026 were not detailed, Alphabet has significantly increased its capital expenditure guidance for the full year 2026 to a range of $195 billion to $205 billion, roughly doubling its 2025 spend, indicating substantial investment in infrastructure to meet growing demand, particularly for AI.
- Free Cash Flow: This metric represents the cash a company has left over after paying for its day-to-day operations and investing in its business (like building new data centers or acquiring equipment). It's the cash that can be used for things like paying down debt, buying back shares, or making acquisitions. For Alphabet, strong free cash flow is vital as it provides the financial flexibility to fund its ambitious "Other Bets" and return value to shareholders without needing to borrow money.
How to Value This Company
The most relevant valuation metric for Alphabet is the P/E ratio (Price-to-Earnings ratio).
The P/E ratio helps you determine if a company's stock price is reasonable compared to the profits it's generating. You calculate it by dividing the current price of one share of the company's stock by its earnings per share (EPS).
For Alphabet, the P/E ratio is particularly useful because it is a consistently profitable company with a long track record of strong earnings. A lower P/E ratio might suggest that the stock is "cheap" relative to how much profit the company is making, while a higher P/E ratio could indicate that investors expect significant future growth and are willing to pay more for each dollar of current earnings. Since Alphabet is a well-established yet still growing technology leader, its earnings are a reliable measure of its value, making the P/E ratio a straightforward way for investors to assess whether the stock is a good investment at its current price. Alphabet reported an EPS of $9.11 for the second quarter of 2026.
⚠️ Disclaimer: This analysis is generated by AI. stockpicker.tech is not responsible for any mistakes, inaccuracies, or hallucinations. This is for educational purposes only and does not constitute financial advice. Users should always double-check the information and conduct their own research before making investment decisions.
Log in to generate a MOAT report for this stock.
Log in to generate an earnings report for this stock.
Log in to generate an operating leverage report for this stock.
Log in to generate a management report for this stock.
Log in to generate a valuation report for this stock.
Alphabet Inc.

Analysis: GOOGL
All analysis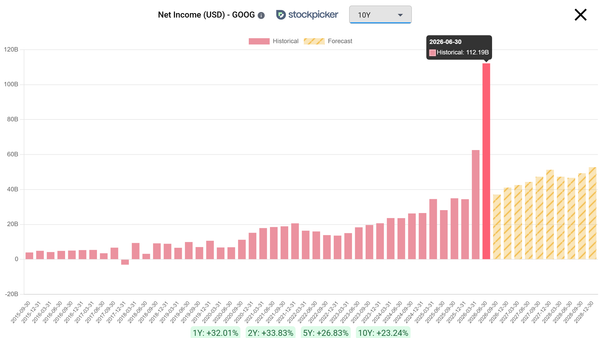
Why is Google P/E so low?
Google's P/E ratio looks unusually low because a one-time accounting gain made its earnings look much bigger than the business actually produced. When earnings jump like that, the P/E ratio drops, even though nothing about the real business got cheaper. Here is what happened. Last quarter Alphabet booked a $98 billion…
Hyperscaler CapEx Is the Only Metric That Matters Right Now
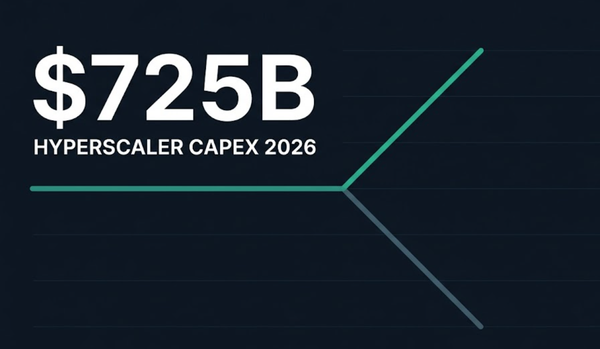
TL;DR: * The four largest hyperscalers are set to spend roughly $725 billion on capex in 2026: Amazon $200B, Microsoft $190B, Alphabet $180-190B, and Meta $125-145B. * This spending is holding up a K-shaped market. AI infrastructure stocks are surging while other industries, like software and financials, have dropped…
Video analysis: GOOGL
All videos
Want a deeper dive on this stock? Request a new video analysis from our team.


