AI Analysis
Generated: 9 weeks ago. (Likely Outdated!)
Costco Wholesale Corporation (Ticker: COST) operates a distinctive business model that prioritizes value for its members, making it a unique player in the retail landscape.
The Business Model (How They Make Money)
Costco's core economic engine is built around a membership-based warehouse club concept. Unlike traditional retailers that primarily rely on marking up products significantly, Costco sells a limited selection of high-quality items in bulk at very low prices, often with an average markup of just 11%. The real genius of their model is that the profits don't mainly come from selling goods. Instead, Costco's primary source of profit is the annual membership fees paid by its customers.
This "two-tiered" approach means that merchandise sales largely cover the costs of running their warehouses and operations, while the membership fees directly contribute to the company's overall profit. This strategy encourages customer loyalty and high sales volumes because members feel they are getting exceptional value.
Costco generates revenue through two main channels:
- Merchandise Sales: This is the largest portion of their revenue, coming from the sale of a wide variety of products, including food, sundries, fresh food, and non-food items. In fiscal year 2025, Costco reported net sales of $269.912 billion.
- Membership Fees: This is the highly profitable segment. Customers pay an annual fee (e.g., Gold Star at $60 or Executive at $120) to gain access to the warehouses and their low prices. In fiscal year 2025, membership fee revenue was $5.323 billion, representing about 1.93% of total revenue. While a small percentage of total revenue, these fees account for a disproportionate share of the company's operating income.
The Metrics That Matter Most
For a company like Costco, which thrives on high sales volume and a unique membership-driven profit model, certain financial metrics are particularly important to watch:
Revenue: This metric tells you the total amount of money Costco brings in from selling goods and collecting membership fees. For a retailer focused on selling a lot of products at low prices, a growing revenue number shows that more people are shopping there and buying more stuff. In fiscal year 2025, Costco's total revenue was $275.235 billion. A consistent increase in revenue indicates that their strategy of offering value and attracting members is working, driving the overall scale of the business.
Net Income: This is the company's bottom-line profit after all expenses, including the cost of goods sold, operating expenses, interest, and taxes, have been paid. It's the ultimate measure of how much money the company actually made for its owners. For fiscal year 2025, Costco reported a net income of $8.099 billion. A healthy and growing net income shows that Costco is not only selling a lot but also managing its costs effectively to turn those sales into real profit.
Operating Margin: This metric shows how much profit Costco makes from its core business operations for every dollar of sales, before accounting for things like interest and taxes. It's calculated by dividing operating income by total revenue. Given Costco's strategy of selling merchandise at very thin profit margins, a stable or improving operating margin highlights their efficiency in running the warehouses and the significant contribution of membership fees to their overall profitability. In fiscal year 2025, Costco's operating income was $10.383 billion, resulting in an operating margin of approximately 3.77% ($10.383 billion / $275.235 billion). This relatively low margin for a retailer underscores the importance of their membership fees in driving overall profitability.
Operating Cash Flow: This metric measures the cash generated by Costco's regular business activities, like selling products and collecting membership fees, before considering any major investments or financing activities. It's a crucial indicator of how much cash the company's operations are actually producing. In fiscal year 2025, Costco's net cash provided by operating activities was $13.335 billion. A strong operating cash flow means the company has plenty of cash coming in from its day-to-day business to pay its bills, invest in growth, and potentially return money to shareholders.
How to Value This Company
The most relevant valuation metric for a stable, profitable company like Costco, which consistently generates earnings, is the P/E ratio (Price-to-Earnings ratio).
The P/E ratio helps you understand if a stock is cheap or expensive compared to how much profit the company makes. You calculate it by taking the current stock price and dividing it by the company's earnings per share (EPS).
Here's why it's useful for Costco: Costco is a mature, well-established business with a predictable revenue stream from its membership fees and consistent merchandise sales. Its earnings tend to be relatively stable. The P/E ratio allows you to compare Costco's stock price to its actual profitability. If Costco's P/E ratio is higher than similar companies or its own historical average, it might suggest investors expect faster future growth or are willing to pay a premium for its stability and strong business model. Conversely, a lower P/E ratio could indicate the stock is undervalued or that investors are less optimistic about its future. For a beginner, it simply tells you how many dollars investors are willing to pay for each dollar of Costco's annual earnings.
⚠️ Disclaimer: This analysis is generated by AI. stockpicker.tech is not responsible for any mistakes, inaccuracies, or hallucinations. This is for educational purposes only and does not constitute financial advice. Users should always double-check the information and conduct their own research before making investment decisions.
Log in to generate a MOAT report for this stock.
Log in to generate an earnings report for this stock.
Log in to generate an operating leverage report for this stock.
Log in to generate a management report for this stock.
Log in to generate a valuation report for this stock.
Costco Wholesale Corporation

Analysis: COST
All analysis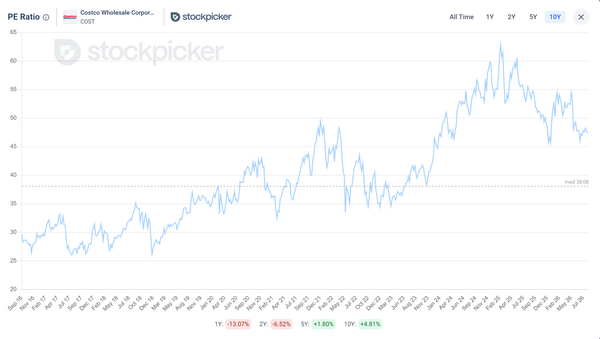
Why Is Costco's P/E Ratio So High?
Costco stock trades at about 47 times earnings while the retail-defensive industry median sits near 17. Costco's P/E ratio is so high because the business has a long track record of operational excellence, and investors expect that record to hold. Costco's business model is quite different from other retailers'. Most…
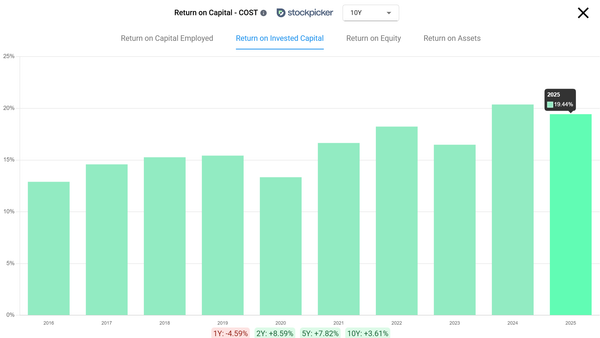
What Is a Good ROIC for a Company?
TL;DR * A good ROIC is above 12%. Above 15% is considered strong. * What counts as good depends on the cost of capital. Most large companies pay 8% to 12%, so a 10% return is standing still. * A high return only matters if the company still has somewhere to reinvest. 20% with a runway beats 40% without one. * ROIC…
Video analysis: COST
All videos
Want a deeper dive on this stock? Request a new video analysis from our team.


