AI Analysis
Generated: 27 weeks ago. (Likely Outdated!)
The Business Model (How They Make Money)
Adobe Inc. primarily makes its money by selling powerful software and services on a subscription basis. Think of it like a membership model for digital tools. Instead of buying a software program once and owning it forever, customers pay a regular fee (monthly or annually) to use Adobe's suite of creative, document, and marketing products. This "subscription" approach provides Adobe with a predictable and recurring stream of income.
Their core business is divided into a few main areas:
- Digital Media: This is where their famous creative applications live, such as Photoshop (for image editing), Illustrator (for graphic design), Premiere Pro (for video editing), and Acrobat (for PDF documents). These are bundled into their "Creative Cloud" and "Document Cloud" offerings. For fiscal year 2023, the Digital Media segment generated $14.22 billion in revenue, which represented about 73% of their total revenue.
- Digital Experience: This segment offers tools and services for businesses to manage customer relationships, analyze marketing campaigns, and build online content. It includes products like Adobe Experience Platform and Adobe Commerce. For fiscal year 2023, the Digital Experience segment brought in $4.87 billion, making up approximately 25% of their total revenue.
- Publishing and Advertising: This smaller segment includes services for publishing and advertising, contributing a relatively small portion to their overall revenue. For fiscal year 2023, this segment generated $0.46 billion, roughly 2% of total revenue.
Essentially, Adobe's economic engine runs on getting customers to sign up for subscriptions to their indispensable software tools and keeping them happy so they renew year after year.
The Metrics That Matter Most
For a company like Adobe, which relies on a recurring subscription model for its software, certain financial numbers give us a clearer picture of its health than others. Here are the 3 most important ones:
- Revenue: This number tells you the total amount of money Adobe brings in from selling its subscriptions and services over a period. For Adobe, looking at revenue growth is like checking the overall pulse of their business. Since they are a subscription company, growing revenue shows that more people are signing up for their software, or existing customers are paying more for additional services. In fiscal year 2023, Adobe's total revenue was $19.41 billion.
- Operating Income: This metric shows how much profit Adobe makes from its core business activities before accounting for things like interest payments or taxes. For a software company, operating income is crucial because it highlights how efficiently they are running their day-to-day operations – covering costs for developing new software, selling it to customers, and managing the company. A healthy operating income indicates that their subscription model is translating well into actual profitability. Adobe reported an operating income of $6.97 billion in fiscal year 2023.
- Free Cash Flow: This is a super important number for any business, but especially for subscription software companies. Free cash flow tells you how much cash a company has left over after paying for all its operating expenses and necessary investments in its business (like upgrading computer systems or developing new features). It’s the cash that can be used for things like buying back its own stock, paying dividends, or pursuing new growth opportunities without having to borrow money. Adobe generated $7.77 billion in free cash flow in fiscal year 2023.
How to Value This Company
When trying to figure out if Adobe's stock is a good deal, the FCF Yield (Free Cash Flow Yield) is a particularly insightful metric for this kind of company.
FCF Yield essentially tells you how much free cash flow a company generates for every dollar of its stock price. You calculate it by taking the company's Free Cash Flow per share and dividing it by the stock price. Think of it like an "earnings yield" but using actual cash instead of just accounting profits.
Here's why it's the best way to value Adobe: Adobe's business model is all about recurring subscriptions, which should ideally generate a lot of consistent cash flow. Unlike some other businesses, software companies don't need a huge amount of physical assets, so a good portion of their earnings often turns directly into cash. A higher FCF Yield generally means you are getting more actual cash generation from the company for each dollar you invest in its stock. It helps you compare Adobe to other companies on how much "cash bang for your buck" you're getting, making it easier to see if the stock is priced fairly based on its ability to generate real money.
⚠️ Disclaimer: This analysis is generated by AI. stockpicker.tech is not responsible for any mistakes, inaccuracies, or hallucinations. This is for educational purposes only and does not constitute financial advice. Users should always double-check the information and conduct their own research before making investment decisions.
Log in to generate a MOAT report for this stock.
Log in to generate an earnings report for this stock.
Log in to generate an operating leverage report for this stock.
Log in to generate a management report for this stock.
Log in to generate a valuation report for this stock.
Adobe Inc.

Analysis: ADBE
All analysis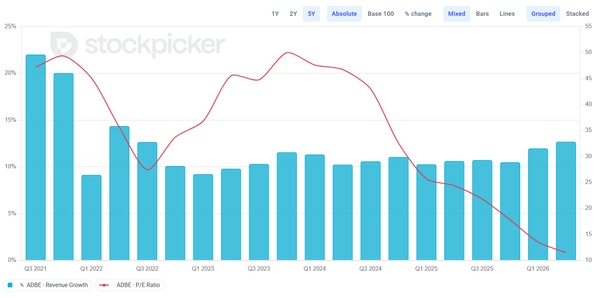
Video analysis: ADBE
All videosNo video analysis for this stock yet. Request one from our team.


