AI Analysis
Generated: 3 weeks ago. (Likely Outdated!)
S&P Global Inc. (Ticker: SPGI) is a powerhouse in the world of financial information, providing essential data, ratings, and benchmarks that help businesses, governments, and investors make informed decisions. Think of them as the trusted scorekeeper and data provider for global markets.
The Business Model (How They Make Money)
S&P Global makes its money primarily by selling access to its valuable information, analytics, and expert opinions, largely through subscriptions. Their core business is built on providing critical insights across various sectors.
As of their full-year 2025 results, S&P Global reported total revenue of $15.336 billion. Their main ways of earning this money come from several key divisions:
- Market Intelligence: This segment provides data, research, and analytics on companies, markets, and industries. It was their largest segment in 2025, generating $4.92 billion, which was about 37.14% of their total revenue.
- Ratings: This division is famous for assessing the creditworthiness of companies and governments, helping investors understand risk. This segment brought in $4.72 billion in 2025.
- Indices: This is where the well-known S&P 500 index comes from. S&P Global earns money by licensing these indices for use in investment products like exchange-traded funds (ETFs). This segment generated $1.85 billion in 2025, representing approximately 13.98% of their total revenue.
- Energy: This segment provides data and insights for the energy and commodities markets.
It's important to note that S&P Global spun off its Mobility division in mid-2026, meaning future financial reports will reflect a company without that segment. The company's revenue streams are largely recurring, coming from subscriptions and fees tied to the assets that track their indices.
The Metrics That Matter Most
For a company like S&P Global, which thrives on providing essential, often subscription-based, information, certain financial metrics give us the best picture of its health and growth.
- Revenue: This is the total amount of money the company brings in from selling its services. For S&P Global, consistent revenue growth shows that more customers are buying their data, ratings, and indices, or that existing customers are paying more for these valuable services. In 2025, S&P Global's revenue increased by 8% year-over-year to $15.336 billion. For the second quarter of 2026, the company reported revenue of $4.15 billion, showing roughly 10% year-over-year growth across all segments.
- Net Income: This metric tells you how much profit the company actually made after paying all its expenses, including taxes. It's the bottom line and shows the company's overall profitability. In 2025, S&P Global's GAAP net income increased by 16% to $4.471 billion. For Q2 2026, net income was $1.22 billion.
- Operating Margin: This percentage shows how much profit S&P Global makes from its core business operations for every dollar of revenue, before accounting for interest and taxes. A high and stable operating margin is crucial for an information services company because it indicates efficient management of costs and strong pricing power for its valuable data and services. In 2025, S&P Global's adjusted operating margin expanded by 140 basis points to 50.4%.
- Free Cash Flow: This is the cash a company generates after paying for its operating expenses and capital expenditures (investments in things like property and equipment). It's the cash truly "free" for things like paying down debt, issuing dividends, or buying back shares. For S&P Global, strong free cash flow indicates its ability to return value to shareholders and invest in future growth without relying on external financing. In 2025, the company returned $6.2 billion to shareholders, including $1.2 billion in dividends and $5.0 billion in share repurchases, which represented 113% of adjusted free cash flow for the year.
How to Value This Company
For a stable, profitable company like S&P Global, which generates consistent earnings from its subscription-based services, the P/E ratio (Price-to-Earnings ratio) is a very useful valuation metric.
The P/E ratio simply compares the company's current stock price to its earnings per share (EPS). In plain English, it tells you how much investors are willing to pay for each dollar of S&P Global's annual earnings.
Here's why it's a good fit: S&P Global is a mature company with a predictable business model and a history of generating profits. When you look at the P/E ratio, you can compare it to S&P Global's historical P/E, or to the P/E ratios of similar companies in the financial information industry. If S&P Global's P/E ratio is lower than its historical average or its competitors, it might suggest the stock is "cheap" or undervalued. If it's higher, it might suggest the stock is "expensive" or overvalued. This helps a beginner understand if they are paying a reasonable price for the company's earnings power. In 2025, S&P Global's GAAP diluted earnings per share was $14.66, and adjusted diluted earnings per share was $17.83. For 2026, adjusted diluted EPS is guided to be in the range of $19.40 to $19.65.
⚠️ Disclaimer: This analysis is generated by AI. stockpicker.tech is not responsible for any mistakes, inaccuracies, or hallucinations. This is for educational purposes only and does not constitute financial advice. Users should always double-check the information and conduct their own research before making investment decisions.
Log in to generate a MOAT report for this stock.
Log in to generate an earnings report for this stock.
Log in to generate an operating leverage report for this stock.
Log in to generate a management report for this stock.
Log in to generate a valuation report for this stock.
S&P Global Inc.

Video analysis: SPGI
All videos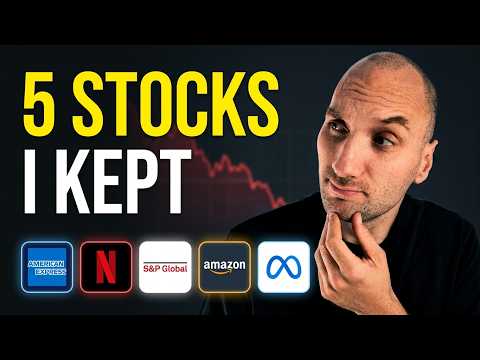
5 Stocks I Refused to Sell(One is up 30%)
I sold 80% of my stock portfolio to pay off my bank loans, but I refused to sell 5 stocks: Meta, Amazon, S&P Global, Netflix and American Express. In this video I explain why each one stayed and why I think all five are still undervalued in 2026.
Is The Market WRONG? My Top 5 Stock Picks for 2026
I bought five companies in late 2025 where stock market analysis shows fundamentals are stronger than current share prices. This breakdown covers my specific investing strategy 2026 outlook. If you are looking for undervalued stocks that were unfairly punished by temporary market sentiment, this analysis explains why I am betting on a rebound for these specific businesses. We look at why the market mispriced these assets and where the real value lies.
Want a deeper dive on this stock? Request a new video analysis from our team.
News: SPGI
Similar companies
-
 MSCI Inc.
MSCI
·
New York Stock Exchange
Compare
MSCI Inc.
MSCI
·
New York Stock Exchange
Compare
-
 Moody's Corporation
MCO
·
New York Stock Exchange
Compare
Moody's Corporation
MCO
·
New York Stock Exchange
Compare
-
 Morningstar, Inc.
MORN
·
NASDAQ
Compare
Morningstar, Inc.
MORN
·
NASDAQ
Compare
-
 FactSet Research Systems Inc.
FDS
·
New York Stock Exchange
Compare
FactSet Research Systems Inc.
FDS
·
New York Stock Exchange
Compare
-
 Value Line, Inc.
VALU
·
NASDAQ
Compare
Value Line, Inc.
VALU
·
NASDAQ
Compare
-
 London Stock Exchange Group plc
LSEGY
·
Other OTC
Compare
London Stock Exchange Group plc
LSEGY
·
Other OTC
Compare