AI Analysis
Generated: 18 weeks ago. (Likely Outdated!)
Credo Technology Group Holding Ltd (CRDO) is a company at the forefront of high-speed data connectivity, playing a crucial role in the infrastructure that powers today's most demanding applications, especially in artificial intelligence (AI) and cloud computing.
The Business Model (How They Make Money)
Credo Technology Group Holding Ltd operates as a "fabless" semiconductor company, meaning they focus on designing and developing advanced chips and solutions, while outsourcing the actual manufacturing to specialized factories. Their core business revolves around providing high-speed connectivity solutions for the vast and growing data infrastructure market.
They make money by selling specialized products and licensing their core technology. Their main products are designed to enable faster, more reliable, and energy-efficient data transfer within data centers and AI clusters. These include:
- Integrated Circuits (ICs): These are specialized chips for optical and line card applications, which are essential components in networking equipment.
- Active Electrical Cables (AECs): These are advanced copper cables that allow data to travel at very high speeds over longer distances than traditional copper cables, crucial for connecting servers and switches in large data centers.
- SerDes Chiplets: These are small, specialized semiconductor components that handle the conversion of data between serial and parallel formats at extremely high speeds, forming the backbone of high-bandwidth communication.
- Intellectual Property (IP) Licensing: Credo also licenses its proprietary Serializer/Deserializer (SerDes) technology to other semiconductor companies, allowing them to integrate Credo's high-speed connectivity capabilities into their own products.
The company's revenue is primarily driven by product sales. In fiscal year 2025, product sales accounted for 94.4% of their total revenue. Credo's growth is significantly fueled by the increasing demand from hyperscale data centers and the rapid expansion of AI and machine learning infrastructure, which require ever-faster and more efficient data movement. For the full fiscal year 2026, Credo reported total revenue of $1.3 billion.
The Metrics That Matter Most
For Credo Technology Group Holding Ltd, a company in a high-growth, innovation-driven sector, the following performance metrics are particularly important:
Revenue: This metric tells us the total amount of money the company brings in from selling its products and services. For Credo, strong revenue growth indicates that their high-speed connectivity solutions are in high demand and are being adopted by key customers, especially in the rapidly expanding AI and cloud markets. For fiscal year 2026, Credo's annual revenue was $1.3 billion, representing a 205.68% increase year-over-year. This significant growth shows their success in capturing market share in a critical technology area.
Gross Margin: This measures the profit a company makes from its sales after subtracting the direct costs of making its products. For a fabless semiconductor company like Credo, a high gross margin indicates strong pricing power for their specialized and proprietary technology, as well as efficient design and cost management. A healthy gross margin is crucial for funding future innovation. Credo reported a GAAP gross margin of 68.2% and a non-GAAP gross margin of 68.3% for the fourth quarter of fiscal year 2026.
R&D Expenses (Research & Development Expenses): This metric shows how much money the company is investing in creating new products and improving existing ones. For a technology company like Credo, which thrives on innovation in a fast-evolving field like high-speed data connectivity, substantial R&D spending is vital for staying competitive and driving future growth. In fiscal year 2025, Credo's R&D expenses were $146 million, representing 33.4% of their revenue. In Q3 2026, R&D spending was $78.5 million. This continued investment is key to their long-term success.
Net Income: This is the company's total profit after all expenses, including operating costs, interest, and taxes, have been deducted from revenue. It's the ultimate measure of a company's profitability. For fiscal year 2026, Credo's non-GAAP net income increased more than five times to $662 million, demonstrating significant bottom-line improvement as their revenue scales.
Free Cash Flow: This metric represents the cash a company generates after accounting for cash outflows to support or expand its operations (like buying new equipment or facilities). It's a crucial indicator of a company's financial health and its ability to fund growth, pay down debt, or return money to shareholders without needing external financing. For the fourth quarter of fiscal year 2026, Credo's free cash flow reached $177.5 million. This shows that the company is not only growing revenue and profits but also generating substantial cash.
How to Value This Company
The ONE most relevant valuation metric for Credo Technology Group Holding Ltd, given its high-growth nature and established profitability in a specialized technology market, is EV/EBITDA.
EV/EBITDA (Enterprise Value to Earnings Before Interest, Taxes, Depreciation, and Amortization): This metric helps investors understand if a company's stock is cheap or expensive by comparing its total value (Enterprise Value) to its core operating earnings before certain non-cash expenses and financing costs (EBITDA).
Here's why it's particularly useful for Credo:
- Focus on Core Operations: EBITDA strips out things like interest payments (which depend on how a company is financed), taxes (which can vary), and depreciation and amortization (which are accounting estimates for asset wear and tear). This allows investors to focus on the cash-generating ability of Credo's actual business operations – designing and selling high-speed connectivity solutions.
- Capital Structure Neutral: Enterprise Value includes both the market value of a company's stock and its net debt (debt minus cash). By using Enterprise Value, EV/EBITDA provides a more complete picture of the company's total value, regardless of how it's financed. This is important for a company like Credo that might have significant cash on its balance sheet ($1.4 billion in cash and short-term investments at the end of FY26) or use debt for growth.
- Good for Growth Companies with Capital Needs: While Credo is "fabless," it still has capital needs for R&D and potentially acquisitions (like Dust Photonics mentioned in search results). EV/EBITDA is often preferred over the P/E ratio for companies with significant upfront investments or varying depreciation schedules, as it provides a clearer view of operational profitability.
To use it, you would compare Credo's EV/EBITDA to that of similar high-growth semiconductor or connectivity companies. If Credo's EV/EBITDA is lower than its peers, it might suggest the stock is undervalued, assuming similar growth prospects and risk profiles. Conversely, a higher EV/EBITDA might indicate it's more expensive. For Q3 2026, Credo's EBITDA was $156.3 million. This metric helps investors assess the value of Credo's operating business relative to its earnings power.
⚠️ Disclaimer: This analysis is generated by AI. stockpicker.tech is not responsible for any mistakes, inaccuracies, or hallucinations. This is for educational purposes only and does not constitute financial advice. Users should always double-check the information and conduct their own research before making investment decisions.
Log in to generate a MOAT report for this stock.
Log in to generate an earnings report for this stock.
Log in to generate an operating leverage report for this stock.
Log in to generate a management report for this stock.
Log in to generate a valuation report for this stock.

Credo Technology Group Holding Ltd


Earnings: CRDO
Estimate against actual revenue and earnings per share, the beat and miss record of recent reports, and how the price moved around each one. Next report: 2 Dec 2026.
Analysis: CRDO
All analysis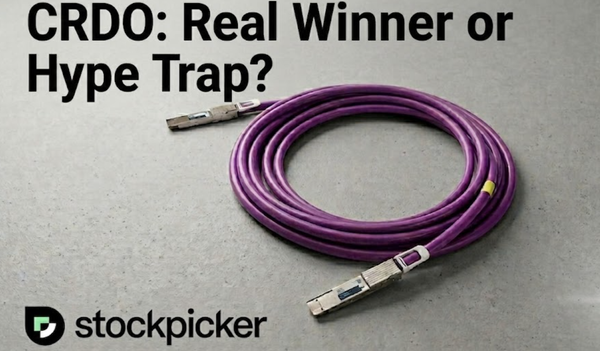
Video analysis: CRDO
All videos
Want a deeper dive on this stock? Request a new video analysis from our team.
News: CRDO
Similar companies
-
 Astera Labs, Inc. Common Stock
ALAB
·
NASDAQ
Compare
-
 Marvell Technology, Inc.
MRVL
·
NASDAQ
Compare
-
 Semtech Corporation
SMTC
·
NASDAQ
Compare
-
 MACOM Technology Solutions Holdings, Inc.
MTSI
·
NASDAQ
Compare
-
 Ciena Corporation
CIEN
·
New York Stock Exchange
Compare
-
 Lumentum Holdings Inc.
LITE
·
NASDAQ
Compare