AI Analysis
Generated: 13 weeks ago. (Likely Outdated!)
"⚠️ Disclaimer: This analysis is generated by AI. stockpicker.tech is not responsible for any mistakes, inaccuracies, or hallucinations. This is for educational purposes only and does not constitute financial advice. Users should always double-check the information and conduct their own research before making investment decisions.\n\n### The Business Model (How They Make Money)\n\nSpace Exploration Technologies Corp., better known as SpaceX, is a company with a bold vision: to make humanity multi-planetary. To achieve this, they've built a unique business model that combines cutting-edge space technology with global connectivity and artificial intelligence. Think of them as a three-engine rocket, each engine contributing to their overall mission and revenue.\n\nSpaceX makes money primarily through three core segments:\n\n1. Starlink (Connectivity): This is SpaceX's satellite internet service, providing high-speed, low-latency internet to customers worldwide, especially in remote or underserved areas. Starlink operates on a subscription model, generating recurring revenue. It's currently the most profitable part of SpaceX's business. In 2025, Starlink generated $11.4 billion in revenue, accounting for 61% of the company's total revenue, and produced $4.4 billion in operating profit. For the first quarter of 2026, Starlink's revenue was $3.3 billion.\n\n2. Launch Services (Space): This is SpaceX's original business, focused on designing, manufacturing, and launching advanced rockets and spacecraft. They provide launch services for commercial customers, government agencies like NASA, and the U.S. Department of Defense, carrying satellites, cargo, and even astronauts into orbit. Key vehicles include the reusable Falcon 9 and Falcon Heavy rockets, with significant investment in the next-generation Starship. In 2025, the Space segment generated $4.1 billion in revenue. However, due to heavy investment in Starship development, this segment ran an operating loss of $657 million in 2025. In Q1 2026, this segment brought in $619 million.\n\n3. AI (xAI): Following its acquisition of xAI in February 2026, SpaceX has expanded into artificial intelligence, developing large language models like Grok and building extensive AI computing infrastructure. This segment aims to leverage AI to optimize its satellite networks and enable autonomous spacecraft navigation, positioning SpaceX to be a significant player in the AI industry. While this is a new and rapidly growing area, it is currently a significant investment phase. In 2025, the AI segment (consolidated with SpaceX's financials) generated $3.2 billion in revenue but recorded a substantial operating loss of $6.35 billion. In Q1 2026, the AI segment produced an operating loss of $2.47 billion.\n\nSpaceX recently went public on June 12, 2026, under the ticker symbol SPCX on the Nasdaq.\n\n### The Metrics That Matter Most\n\nFor a company like SpaceX, which is in a high-growth, capital-intensive, and innovation-driven industry, certain financial metrics are particularly important to understand its health and future potential.\n\n1. Revenue: This number tells you the total amount of money the company brings in from selling its products and services. For SpaceX, watching Revenue is crucial because it shows how quickly they are growing their core businesses—launching rockets, providing internet, and developing AI. Strong revenue growth indicates increasing demand for their services and successful expansion into new markets. SpaceX reported total revenue of $18.7 billion in 2025, growing to $4.7 billion in Q1 2026.\n\n2. Net Income: This is the company's ""bottom line"" – the profit left after all expenses, including taxes, have been paid. While SpaceX is generating significant revenue, it's also investing heavily. Net Income shows whether the company is currently profitable overall. For 2025, SpaceX reported a net loss of $4.9 billion, and a net loss of $5 billion in Q1 2026, primarily due to massive investments in Starship and AI infrastructure.\n\n3. Operating Cash Flow: This metric measures the cash generated from a company's normal business operations before accounting for major investments or financing activities. For SpaceX, a positive and growing Operating Cash Flow is vital because it shows that their core businesses, especially Starlink, are generating enough cash to fund day-to-day activities and contribute to their ambitious projects. SpaceX's net cash from operating activities was $6.8 billion in 2025 and $1.05 billion in Q1 2026.\n\n4. R&D Expenses (Research & Development Expenses): This represents the money a company spends on developing new products, services, or improving existing ones. For SpaceX, R&D is the lifeblood of its innovation, funding projects like the Starship rocket and advanced AI models. High R&D spending, like the $3 billion invested in Starship development in 2025, indicates a commitment to future growth and technological leadership, even if it impacts current profitability. The significant operating losses in the AI segment also reflect substantial R&D and infrastructure investment.\n\n5. CapEx (Capital Expenditures): This refers to the money a company spends to acquire, upgrade, and maintain physical assets like buildings, machinery, and equipment. For SpaceX, CapEx is enormous because they are constantly building rockets, launching satellites for Starlink, and constructing massive AI data centers. High CapEx, such as the $20.7 billion in 2025 (with $12.7 billion for AI infrastructure), shows the scale of their investment in infrastructure necessary to expand their operations and achieve their long-term goals.\n\n### How to Value This Company\n\nFor a company like SpaceX, which is growing rapidly, making massive investments, and currently reporting net losses despite strong operational cash flow, the EV/EBITDA (Enterprise Value to Earnings Before Interest, Taxes, Depreciation, and Amortization) ratio is a very useful valuation metric.\n\nHere's why and how to think about it:\n\n* What it is: Enterprise Value (EV) is like the total price tag of the entire company, including its market value (what all its shares are worth) plus its debt, minus any cash it has. EBITDA is a measure of a company's operating profitability before accounting for non-cash expenses like depreciation and amortization, as well as interest and taxes.\n* Why it matters for SpaceX: SpaceX is a very capital-intensive business. They spend a lot of money building rockets, satellites, and AI infrastructure, which leads to significant depreciation (the accounting way of spreading the cost of an asset over its useful life). They also have considerable debt to fund these projects. Net income can look low or negative because of these large non-cash expenses and interest payments. EBITDA, however, gives a clearer picture of the cash profit generated from their core operations before these big accounting adjustments and financing costs.\n* How to use it: You compare SpaceX's EV/EBITDA to similar companies in the space, telecommunications, or high-growth tech sectors (if you can find any truly comparable ones). If SpaceX's ratio is much higher than its peers, it might suggest the stock is expensive, implying investors expect very high future growth. If it's lower, it could suggest it's undervalued. For example, SpaceX had an adjusted EBITDA of $6.6 billion in 2025. With an IPO valuation around $1.77 trillion, you would divide the Enterprise Value by this EBITDA figure to get the ratio. This helps you understand how much investors are willing to pay for each dollar of the company's operational cash-generating power, making it a good tool for valuing companies with heavy investments and varying profitability."
⚠️ Disclaimer: This analysis is generated by AI. stockpicker.tech is not responsible for any mistakes, inaccuracies, or hallucinations. This is for educational purposes only and does not constitute financial advice. Users should always double-check the information and conduct their own research before making investment decisions.
Log in to generate a MOAT report for this stock.
Log in to generate an earnings report for this stock.
Log in to generate an operating leverage report for this stock.
Log in to generate a management report for this stock.
Log in to generate a valuation report for this stock.
Space Exploration Technologies Corp.

Analysis: SPCX
All analysis
Video analysis: SPCX
All videos
SPCX Stock Analysis: Is SpaceX Overvalued at $2 Trillion?
SpaceX is widely viewed as the world's leading space company. But according to some Wall Street projections, less than 2% of its future revenue could come from the actual space business.

3 Massive Market Traps to Avoid: Nuclear, Quantum & Space Stocks
Today we use fundamental analysis on Stockpicker to look at the real valuation metrics behind the massive market hype. Before you buy into the next big trend, look at the math so you don't end up holding the bag.
Want a deeper dive on this stock? Request a new video analysis from our team.
News: SPCX

Got $1,000? An Investment in SpaceX Could Be Worth This Much by the End of 2027.
SpaceX is highly valued for its current growth. xAI holds the keys to SpaceX being a great stock to own.
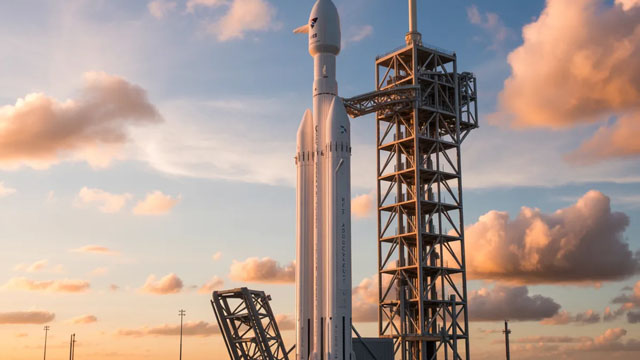
SpaceX: Taking Flight And Defying Lock-Ups Ahead Of Q4, Communacopia Takeaways
SpaceX is reiterated as a buy, with shares resilient despite volatility and ongoing lock-up expirations. Q2 results showed revenue up 90% to $7.8B and a reduced net loss, with aggressive AI expansion and strong Starlink subscriber growth. Management targets $100B run-rate revenue by December 2026, with AI as the primary growth engine and major new cloud deals secured.
Grok picks 3 SpaceX ETFs to buy now
Investors looking for exposure to SpaceX (NASDAQ: SPCX) and the fast-growing commercial space industry can turn to exchange-traded funds (ETFs).

RFG Advisory LLC Invests $888,000 in SpaceX $SPCX
RFG Advisory LLC bought a new stake in shares of SpaceX (NASDAQ: SPCX) during the undefined quarter, according to its most recent disclosure with the Securities and Exchange Commission. The institutional investor bought 5,197 shares of the company's stock, valued at approximately $888,000. Other institutional investors have also added to or reduced their
3 Reasons SpaceX Stock Could Crash in Q4 -- and 1 Reason It Won't
The stock is down more than 7% so far this year, but up from its IPO price. SpaceX's 180-day lockout period ends in the fourth quarter.

Predicting the Value of a $10,000 Bet on SpaceX by 2030
SpaceX's revenues are expected to skyrocket in the next several years. Its expensive valuation and heavy spending on AI infrastructure are both major risk factors.

$1,000 invested in SpaceX stock at IPO is now worth
SpaceX (NASDAQ: SPCX) shares have delivered a modest gain for early public investors three months after the company's historic debut.

If SpaceX Stock Falls Below $100, History Suggests This Is the Move to Make
Since its public debut in June, SpaceX stock has soared to as much as 50% above its opening trading price, and has also slumped to as far as 30% below it. Analysis of other recent tech IPOs suggests that buying into volatility can eventually pay off for patient investors.