AI Analysis

Log in to generate an AI summary for this stock.

Log in to generate a MOAT report for this stock.

Log in to generate an earnings report for this stock.

Log in to generate an operating leverage report for this stock.

Log in to generate a management report for this stock.

Log in to generate a valuation report for this stock.

Profound Medical Corp.

$5.97 -$1.69 (-22.06%)
NASDAQ · 11 Sep 2026 20:00 UTC
Previous Close
$5.96
Day Range
$5.5$6.45
Year Range
$3.9$8.95
Market Cap
216.94M
AVG Volume
95.08K
Trailing/Forward PE
-6.23/-
PEG ratio
0.22
Dividend Yield
-
Next Earnings Date
2026-11-12
Primary Exchange
NASDAQUS
Revenue (USD)
02M4M6M24 Q124 Q224 Q324 Q425 Q125 Q225 Q325 Q426 Q126 Q2
PROF Revenue (USD) by quarter
PeriodRevenue (USD)
26 Q22.48M
26 Q15.26M
25 Q45.98M
25 Q35.29M
25 Q22.21M
25 Q12.62M
24 Q44.06M
24 Q32.83M
24 Q22.23M
24 Q11.44M
Net Income (USD)
-20M-15M-10M-5M024 Q124 Q224 Q324 Q425 Q125 Q225 Q325 Q426 Q126 Q2
PROF Net Income (USD) by quarter
PeriodNet Income (USD)
26 Q2-9.54M
26 Q1-6.96M
25 Q4-8.18M
25 Q3-7.98M
25 Q2-15.7M
25 Q1-10.72M
24 Q4-5.33M
24 Q3-9.37M
24 Q2-6.92M
24 Q1-6.58M
Operating Income (USD)
-15M-10M-5M024 Q124 Q224 Q324 Q425 Q125 Q225 Q325 Q426 Q126 Q2
PROF Operating Income (USD) by quarter
PeriodOperating Income (USD)
26 Q2-11.07M
26 Q1-7.91M
25 Q4-7.37M
25 Q3-8.91M
25 Q2-13.81M
25 Q1-11.17M
24 Q4-8.11M
24 Q3-9.06M
24 Q2-7.84M
24 Q1-7.88M
EBITDA (USD)
-15M-10M-5M024 Q124 Q224 Q324 Q425 Q125 Q225 Q325 Q426 Q126 Q2
PROF EBITDA (USD) by quarter
PeriodEBITDA (USD)
26 Q2-9.35M
26 Q1-7.81M
25 Q4-7.26M
25 Q3-8.77M
25 Q2-13.66M
25 Q1-11M
24 Q4-12.06M
24 Q3-8.78M
24 Q2-6.66M
24 Q1-7.63M
Cash Flows (USD)
-15M-10M-5M024 Q124 Q224 Q324 Q425 Q125 Q225 Q325 Q426 Q126 Q2
PROF Cash Flows (USD) by quarter
PeriodCash Flows (USD)
26 Q2-11.34M
26 Q1-8.58M
25 Q4-6.84M
25 Q3-9.61M
25 Q2-13.74M
25 Q1-8.28M
24 Q4-5.64M
24 Q3-6.83M
24 Q2-6.22M
24 Q1-4.53M
EPS (USD)
-0.6-0.4-0.2-024 Q124 Q224 Q324 Q425 Q125 Q225 Q325 Q426 Q126 Q2
PROF EPS (USD) by quarter
PeriodEPS (USD)
26 Q2-0.26
26 Q1-0.19
25 Q4-0.27
25 Q3-0.27
25 Q2-0.52
25 Q1-0.36
24 Q4-0.21
24 Q3-0.38
24 Q2-0.28
24 Q1-0.26
Expenses (USD)
010M20M30M40MR&DSG&ACapex24 Q124 Q224 Q324 Q425 Q125 Q225 Q325 Q426 Q126 Q2
PROF Expenses (USD) by quarter
PeriodExpenses (USD)
26 Q213.01M
26 Q111.69M
25 Q411.54M
25 Q312.84M
25 Q215.42M
25 Q113.02M
24 Q430.51M
24 Q312.24M
24 Q29.26M
24 Q18.74M
Cash & Debt (USD)
025M50M75M100MCashLong Term DebtShort Term Debt24 Q124 Q224 Q324 Q425 Q125 Q225 Q325 Q426 Q126 Q2
PROF Cash & Debt (USD) by quarter
PeriodCash & Debt (USD)
26 Q238.27M
26 Q150.46M
25 Q481.8M
25 Q324.83M
25 Q235.2M
25 Q146.43M
24 Q454.91M
24 Q327.12M
24 Q246.63M
24 Q155.78M
Debt ratios
00.511.5224 Q124 Q224 Q324 Q425 Q125 Q225 Q325 Q426 Q126 Q2
PROF Debt ratios by quarter
PeriodDebt ratios
26 Q20.93
26 Q11.15
25 Q41.85
25 Q30.54
25 Q20.67
25 Q11.08
24 Q41.42
24 Q30.61
24 Q21.18
24 Q11.47
Margins
0%20%40%60%80%24 Q124 Q224 Q324 Q425 Q125 Q225 Q325 Q426 Q126 Q2
PROF Margins by quarter
PeriodMargins
26 Q278.41%
26 Q171.8%
25 Q466.77%
25 Q374.32%
25 Q273.18%
25 Q170.7%
24 Q470.94%
24 Q363.14%
24 Q263.64%
24 Q160.18%
Return on Capital
-40%-30%-20%-10%0%24 Q124 Q224 Q324 Q425 Q125 Q225 Q325 Q426 Q126 Q2
PROF Return on Capital by quarter
PeriodReturn on Capital
26 Q2-19.17%
26 Q1-11.67%
25 Q4-8.98%
25 Q3-24.82%
25 Q2-39.98%
25 Q1-21.11%
24 Q4-8.83%
24 Q3-30.15%
24 Q2-12.88%
24 Q1-10.68%
Shares Outstanding
010M20M30M40M24 Q124 Q224 Q324 Q425 Q125 Q225 Q325 Q426 Q126 Q2
PROF Shares Outstanding by quarter
PeriodShares Outstanding
26 Q236.35M
26 Q136.3M
25 Q430.73M
25 Q330.1M
25 Q230.05M
25 Q130.04M
24 Q425.77M
24 Q324.64M
24 Q224.44M
24 Q123.84M
Book Value Per Share (USD)
012324 Q124 Q224 Q324 Q425 Q125 Q225 Q325 Q426 Q126 Q2
PROF Book Value Per Share (USD) by quarter
PeriodBook Value Per Share (USD)
26 Q21.37
26 Q11.64
25 Q42.96
25 Q31.07
25 Q21.31
25 Q11.69
24 Q42.34
24 Q31.26
24 Q22.2
24 Q12.59
Total Assets (USD)
050M100M150M200M24 Q124 Q224 Q324 Q425 Q125 Q225 Q325 Q426 Q126 Q2
PROF Total Assets (USD) by quarter
PeriodTotal Assets (USD)
26 Q262.38M
26 Q173.7M
25 Q4192.94M
25 Q342.3M
25 Q249.67M
25 Q160.86M
24 Q470.23M
24 Q342.23M
24 Q268.45M
24 Q177.26M
Employee Count
050100150200202320242025
PROF Employee Count by quarter
PeriodEmployee Count
2025162
2024142
2023142
Free Cash Flow Yield
-30%-25%-20%-15%-10%med -15.69%Dec 24Apr 25Jul 25Oct 25Feb 26May 26Sep 26
PROF Free Cash Flow Yield by quarter
PeriodFree Cash Flow Yield
Sep 26-16.76%
Sep 26-14.52%
Aug 26-14.61%
Aug 26-14.74%
Aug 26-15.09%
Aug 26-13.5%
Jul 26-14.48%
Jul 26-14.72%
Jul 26-15.6%
Jul 26-15.18%
Jul 26-15.69%
Jun 26-16.44%
Jun 26-15.55%
Jun 26-16.11%
Jun 26-16.04%
May 26-15.69%
May 26-15.64%
May 26-15.33%
May 26-15.6%
May 26-17.28%
Apr 26-16.95%
Apr 26-17.82%
Apr 26-19.92%
Apr 26-18.43%
Mar 26-19.15%
Mar 26-23.42%
Mar 26-21.51%
Mar 26-22.32%
Feb 26-16.53%
Feb 26-18.07%
Feb 26-19.05%
Feb 26-19.38%
Jan 26-16.77%
Jan 26-15.8%
Jan 26-15.3%
Jan 26-14.9%
Jan 26-16.42%
Dec 25-17.06%
Dec 25-16.48%
Dec 25-17.16%
Dec 25-19.05%
Nov 25-19.05%
Nov 25-20.93%
Nov 25-18.36%
Nov 25-18.86%
Oct 25-18.58%
Oct 25-20.5%
Oct 25-20.39%
Oct 25-19.21%
Oct 25-19.85%
Sep 25-21.6%
Sep 25-25.98%
Sep 25-27.91%
Sep 25-27.37%
Aug 25-25.23%
Aug 25-23.79%
Aug 25-26.53%
Aug 25-15.19%
Aug 25-15.3%
Jul 25-14.82%
Jul 25-14.92%
Jul 25-14.48%
Jul 25-14.07%
Jun 25-14.02%
Jun 25-13.25%
Jun 25-12.87%
Jun 25-15.11%
May 25-15.97%
May 25-16.4%
May 25-17.87%
May 25-18.17%
May 25-17.82%
Apr 25-19.58%
Apr 25-19.49%
Apr 25-19.87%
Apr 25-18.64%
Mar 25-15.4%
Mar 25-13.68%
Mar 25-13.41%
Mar 25-13.58%
Feb 25-13.3%
Feb 25-12.32%
Feb 25-13.76%
Feb 25-15.36%
Jan 25-14.29%
Jan 25-13.07%
Jan 25-12.54%
Jan 25-12.17%
Jan 25-11.83%
Dec 24-12.89%
Dec 24-12.71%
Dec 24-12.45%
Dec 24-12.3%
Nov 24-11.35%
Nov 24-12.21%
Nov 24-11.51%
Nov 24-10.53%
Nov 24-11.99%
Oct 24-12.05%
Oct 24-11.37%
Price to Sales
510152025med 15.24Dec 24Apr 25Jul 25Oct 25Feb 26May 26Sep 26
PROF Price to Sales by quarter
PeriodPrice to Sales
Sep 2611.41
Sep 2613.17
Aug 2613.1
Aug 2612.98
Aug 2612.68
Aug 2614.17
Jul 2614.29
Jul 2614.06
Jul 2613.27
Jul 2613.64
Jul 2613.19
Jun 2612.59
Jun 2613.31
Jun 2612.84
Jun 2612.9
May 2613.19
May 2613.23
May 2613.5
May 2613.27
May 2613.42
Apr 2613.67
Apr 2613.01
Apr 2611.64
Apr 2612.58
Mar 2612.11
Mar 269.9
Mar 2610.78
Mar 2610.39
Feb 2618.54
Feb 2616.96
Feb 2616.08
Feb 2615.82
Jan 2618.28
Jan 2619.4
Jan 2620.03
Jan 2620.57
Jan 2618.67
Dec 2517.96
Dec 2518.59
Dec 2517.86
Dec 2516.08
Nov 2516.08
Nov 2514.65
Nov 2516.69
Nov 2516.16
Oct 2516.4
Oct 2514.86
Oct 2514.94
Oct 2515.86
Oct 2515.35
Sep 2514.1
Sep 2511.73
Sep 2510.91
Sep 2511.13
Aug 2512.08
Aug 2512.81
Aug 2511.48
Aug 2515.2
Aug 2515.09
Jul 2515.58
Jul 2515.47
Jul 2515.94
Jul 2516.4
Jun 2516.46
Jun 2517.42
Jun 2517.94
Jun 2515.28
May 2514.46
May 2514.07
May 2512.92
May 2512.7
May 2512.26
Apr 2511.16
Apr 2511.21
Apr 2511
Apr 2511.72
Mar 2514.18
Mar 2515.97
Mar 2516.29
Mar 2516.08
Feb 2519.72
Feb 2521.28
Feb 2519.06
Feb 2517.07
Jan 2518.35
Jan 2520.06
Jan 2520.91
Jan 2521.54
Jan 2522.16
Dec 2420.34
Dec 2420.63
Dec 2421.05
Dec 2421.31
Nov 2423.1
Nov 2421.48
Nov 2422.79
Nov 2424.9
Nov 2423.58
Oct 2423.45
Oct 2424.87
Price to Book
02468med 4.18Dec 24Apr 25Jul 25Oct 25Feb 26May 26Sep 26
PROF Price to Book by quarter
PeriodPrice to Book
Sep 264.36
Sep 265.03
Aug 265
Aug 264.96
Aug 264.84
Aug 265.41
Jul 264.49
Jul 264.42
Jul 264.17
Jul 264.29
Jul 264.15
Jun 263.96
Jun 264.18
Jun 264.04
Jun 264.05
May 264.15
May 264.16
May 264.24
May 264.17
May 262.32
Apr 262.36
Apr 262.25
Apr 262.01
Apr 262.17
Mar 262.09
Mar 261.71
Mar 261.86
Mar 261.79
Feb 267.13
Feb 266.52
Feb 266.18
Feb 266.08
Jan 267.02
Jan 267.46
Jan 267.7
Jan 267.9
Jan 267.17
Dec 256.9
Dec 257.15
Dec 256.87
Dec 256.18
Nov 256.18
Nov 255.63
Nov 256.42
Nov 254.58
Oct 254.65
Oct 254.21
Oct 254.23
Oct 254.49
Oct 254.35
Sep 254
Sep 253.32
Sep 253.09
Sep 253.15
Aug 253.42
Aug 253.63
Aug 253.25
Aug 253.28
Aug 253.25
Jul 253.36
Jul 253.34
Jul 253.44
Jul 253.54
Jun 253.55
Jun 253.76
Jun 253.87
Jun 253.29
May 253.12
May 253.03
May 252.79
May 252.74
May 252.23
Apr 252.03
Apr 252.04
Apr 252
Apr 252.13
Mar 252.58
Mar 252.9
Mar 252.96
Mar 252.93
Feb 255.5
Feb 255.93
Feb 255.31
Feb 254.76
Jan 255.12
Jan 255.59
Jan 255.83
Jan 256.01
Jan 256.18
Dec 245.67
Dec 245.75
Dec 245.87
Dec 245.94
Nov 246.44
Nov 245.99
Nov 246.35
Nov 246.94
Nov 242.84
Oct 242.83
Oct 243
Profound Medical Corp.
PROF
Stockpicker

Video analysis: PROF

All videos

No video analysis for this stock yet. Request one from our team.

Your email is used only to follow up on this request. We do not add you to marketing lists. Privacy Policy

News: PROF

Profound Medical to Participate in Lake Street's 10th Annual Best Ideas Growth Conference

globenewswire.com · 3 Sep 2026

Profound Medical to Participate in Lake Street's 10th Annual Best Ideas Growth Conference

TORONTO, Sept. 03, 2026 (GLOBE NEWSWIRE) -- Profound Medical Corp. (NASDAQ:PROF; TSX:PRN) (“Profound” or the “Company”), a commercial-stage medical device company that develops and markets innovative interventional MRI (iMRI) procedures, announced today that management will participate in the Lake Street Capital Markets “BIG10” Conference on September 10, 2026 in New York City.

Profound Medical Further Strengthens Executive Leadership Team with Appointment of Richard Fabian as President

globenewswire.com · 1 Sep 2026

Profound Medical Further Strengthens Executive Leadership Team with Appointment of Richard Fabian as President

TORONTO, Sept. 01, 2026 (GLOBE NEWSWIRE) -- Profound Medical Corp. (NASDAQ:PROF; TSX:PRN) (“Profound” or the “Company”), a commercial-stage medical device company that develops and markets innovative interventional MRI (iMRI) procedures, today announced the appointment of Richard Fabian as its new President, effective immediately.

Profound's Introduction of New Real-time Interventional MRI Software Paving the Way for Full ‘TULSA Days'

globenewswire.com · 17 Aug 2026

Profound's Introduction of New Real-time Interventional MRI Software Paving the Way for Full ‘TULSA Days'

Most recent TDC software provides a potential roadmap for customers to easily achieve up to 6 TULSA Procedures™ per system per day Most recent TDC software provides a potential roadmap for customers to easily achieve up to 6 TULSA Procedures™ per system per day

Profound Medical Announces Management Change

globenewswire.com · 14 Aug 2026

Profound Medical Announces Management Change

TORONTO, Aug. 14, 2026 (GLOBE NEWSWIRE) -- Profound Medical Corp. (NASDAQ:PROF; TSX:PRN) (“Profound” or the “Company”), a commercial-stage medical device company that develops and markets innovative interventional MRI (iMRI) procedures, today announced the promotion of Matthew Sobczyk from Corporate Controller to Interim Chief Financial Officer, effective immediately. Mr. Sobczyk, who first joined Profound in 2020, succeeds Rashed Dewan, who has stepped down as the Company's Chief Financial Officer.

Profound Medical Launches ‘Let's Huddle', a Global Community Supporting Men Throughout Their Prostate Care Journey

globenewswire.com · 13 Aug 2026

Profound Medical Launches ‘Let's Huddle', a Global Community Supporting Men Throughout Their Prostate Care Journey

A patient-centered initiative focused on education, connection, and support A patient-centered initiative focused on education, connection, and support
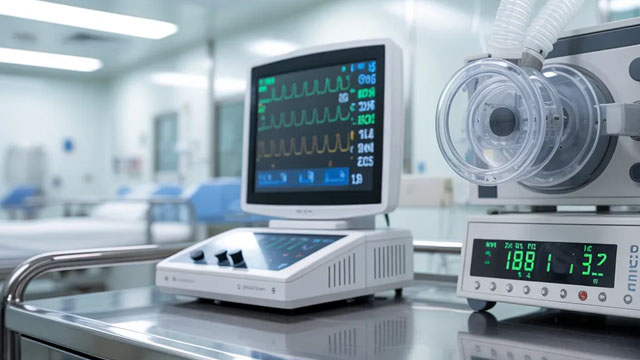
Profound Medical Q2 Earnings Call Highlights

marketbeat.com · 7 Aug 2026

Profound Medical Q2 Earnings Call Highlights

Profound Medical NASDAQ: PROF reported second-quarter 2026 revenue of CAD 2.5 million, up 12% from CAD 2.2 million a year earlier, as the company said the reported figure was affected by the timing of TULSA product shipments completed in July rather than June.

Profound Medical (PROF) Q2 Earnings Surpass Estimates

zacks.com · 6 Aug 2026

Profound Medical (PROF) Q2 Earnings Surpass Estimates

Profound Medical (PROF) came out with quarterly earnings of $0.26 per share, beating the Zacks Consensus Estimate of a loss of $0.22 per share. This compares to a loss of $0.52 per share a year ago.

Profound Medical Reports Second Quarter 2026 Financial Results

globenewswire.com · 6 Aug 2026

Profound Medical Reports Second Quarter 2026 Financial Results

– Operating expenses decline 16%, helping drive a 39% improvement in net loss – – Approximately $3.1 million of TULSA revenue recognition shifts into early Q3 due to shipment timing – – Strong clinical, commercial and reimbursement momentum continues – – Company reiterates full-year 2026 revenue guidance – – Announces first employer owned health plans to list the TULSA Procedure™ as a covered service – TORONTO, Aug. 06, 2026 (GLOBE NEWSWIRE) -- Profound Medical Corp. (NASDAQ:PROF; TSX:PRN) (“Profound” or the “Company”), a commercial-stage medical device company that develops and markets innovative interventional MRI (“iMRI”) procedures, today announced financial results for the second quarter ended June 30, 2026. Unless specified otherwise, all amounts in this press release are expressed in U.S. dollars and are presented in accordance with U.S. generally accepted accounting principles (U.S. GAAP).

Similar companies

Disclaimer: The historical data presented on this platform is provided by Financial Modeling Prep. Stock Picker is a platform for informational purposes only and does not provide financial advice. Users are encouraged to conduct their own research and consult with a qualified financial advisor before making investment decisions.