AI Analysis
Generated: 16 weeks ago. (Likely Outdated!)
"⚠️ Disclaimer: This analysis is generated by AI. stockpicker.tech is not responsible for any mistakes, inaccuracies, or hallucinations. This is for educational purposes only and does not constitute financial advice. Users should always double-check the information and conduct their own research before making investment decisions.\n\n### The Business Model (How They Make Money)\n\nCerebras Systems Inc. (CBRS) is an artificial intelligence (AI) company that designs and builds specialized computer hardware and software to make AI computations incredibly fast. Think of them as creating super-powered brains for AI, far more efficient than standard computer chips for complex AI tasks. Their core mission is to accelerate AI by making it faster, easier to use, and more energy-efficient.\n\nThe company's main products include its unique Wafer-Scale Engine (WSE-3) semiconductors, which are essentially entire silicon wafers turned into single, massive processors, and its CS-3 supercomputers that house these chips. These systems are designed for organizations that need supercomputer-level performance for training large AI models or handling vast amounts of data.\n\nCerebras generates its money through a few key avenues:\n* Hardware Sales: This is their primary revenue source, coming from selling their high-performance CS-3 systems. These systems are typically priced in the millions of dollars and are sold to high-end customers with significant AI computing needs. In 2025, hardware sales accounted for approximately $358 million, representing about 70% of their total revenue.\n* Professional Services: Cerebras offers services like helping customers prepare their data, design AI models, oversee training, and optimize their systems. This service component is significant, accounting for between a quarter and a third of new customer engagements.\n* Cloud Services: The company also provides access to its powerful systems through cloud-based offerings and its AI Model Studio. This creates a recurring revenue stream, allowing smaller teams or those who don't want to buy the full hardware to use Cerebras's computing power. In 2025, cloud and other services revenue reached $151.6 million, growing 99% year-over-year.\n\nA significant portion of Cerebras's revenue in 2025 came from a few large customers, with two UAE-linked customers (Mohamed bin Zayed University of Artificial Intelligence and G42) accounting for approximately 86% of their 2025 revenue. However, the company has recently secured major deals with OpenAI and Amazon Web Services (AWS), which are expected to diversify its customer base and revenue streams going forward.\n\n### The Metrics That Matter Most\n\nFor Cerebras Systems, given its focus on cutting-edge AI hardware and its recent public offering, these are the most important financial pulses to monitor:\n\n1. Revenue: This metric tells you the total amount of money the company brings in from selling its products and services. For Cerebras, a company in a high-growth industry with innovative technology, strong revenue growth is crucial. It shows that customers are adopting their unique wafer-scale AI solutions and that their market is expanding. In 2025, Cerebras reported revenue of $510.0 million, a 76% increase from the previous year. This rapid growth indicates increasing demand for their specialized AI infrastructure.\n\n2. Operating Income: This metric shows how much profit a company makes from its core business operations before accounting for things like interest and taxes. For Cerebras, operating income is particularly important because their reported net income in 2025 was significantly boosted by a one-time accounting gain that wasn't related to their day-to-day business. Looking at operating income gives a clearer picture of whether their actual business of selling AI chips and services is profitable. In 2025, Cerebras reported an operating loss of $145.9 million, indicating that while revenue is growing, the company is still investing heavily in its operations and not yet profitable from its core business activities.\n\n3. Gross Margin: This metric reveals the percentage of revenue left after subtracting the direct costs of making and selling their products and services. For a hardware-centric company like Cerebras, a healthy gross margin is vital because it shows how profitable their core products are before considering overhead like research and development or sales. A strong gross margin indicates that their innovative technology commands a good price relative to its production cost. Cerebras reported a gross margin of 39% in 2025. This figure is important to watch, especially as the company expands its cloud services, which tend to have lower margins than hardware sales.\n\n4. R&D Expenses (Research & Development Expenses): This metric represents the money a company spends on developing new products, services, or improving existing ones. For Cerebras, a company built on groundbreaking AI chip technology, R&D expenses are a critical indicator of its commitment to innovation and staying competitive. High R&D spending is expected and necessary to maintain its technological edge in the rapidly evolving AI landscape. In 2025, Cerebras spent $243.3 million on R&D, which was a substantial 48% of its total sales. This highlights their intense focus on pushing the boundaries of AI computing.\n\n### How to Value This Company\n\nThe most relevant valuation metric for Cerebras Systems is the P/Sales (Price-to-Sales) ratio.\n\nThe P/Sales ratio compares a company's stock price to its total revenue. You calculate it by taking the company's total market value (all its shares multiplied by the current stock price) and dividing it by its total sales (revenue) over the last year.\n\nHere's why it's the best way to figure out if Cerebras's stock is cheap or expensive right now:\nCerebras is a high-growth company in an emerging and capital-intensive industry. As we saw, it's not yet consistently profitable from its core operations, and its net income in 2025 was influenced by a one-time accounting event. When a company isn't consistently making a profit, traditional valuation metrics like the P/E (Price-to-Earnings) ratio, which relies on earnings, become less meaningful or even negative.\n\nThe P/Sales ratio, however, focuses on the company's ability to generate revenue, which is a key indicator of its market adoption and growth potential. For a company like Cerebras, which is investing heavily in R&D and expanding its infrastructure to capture a large market opportunity, revenue growth is paramount. Investors are often willing to pay a higher P/Sales ratio for companies that are growing rapidly and have a strong competitive position, even if they are not yet highly profitable. It helps investors gauge how much they are paying for each dollar of the company's sales, providing a way to compare its valuation against other growth companies in the tech or semiconductor space. As of its IPO, Cerebras was trading at a very high P/Sales ratio, reflecting significant investor enthusiasm for its AI technology and growth prospects."
⚠️ Disclaimer: This analysis is generated by AI. stockpicker.tech is not responsible for any mistakes, inaccuracies, or hallucinations. This is for educational purposes only and does not constitute financial advice. Users should always double-check the information and conduct their own research before making investment decisions.
Log in to generate a MOAT report for this stock.
Log in to generate an earnings report for this stock.
Log in to generate an operating leverage report for this stock.
Log in to generate a management report for this stock.
Log in to generate a valuation report for this stock.
Cerebras Systems Inc.

Video analysis: CBRS
All videosNo video analysis for this stock yet. Request one from our team.
News: CBRS

Cerebras Systems vs. IonQ: Which Tech Stock Is a Better Buy in 2026?
Cerebras Systems offers unique wafer-scale technology and is growing revenue at high rates. IonQ is a leader in trapped-ion quantum computing with triple-digit revenue growth.
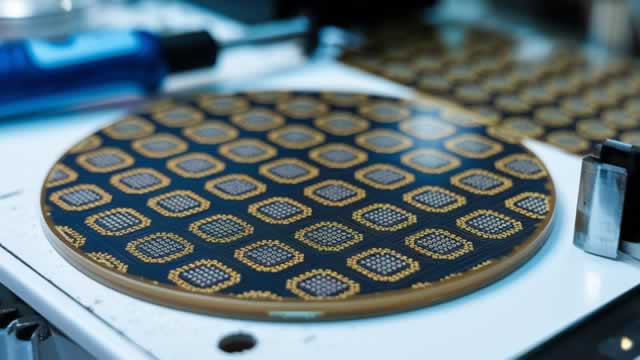
Cerebras (CBRS) Down 17.2% Since Last Earnings Report: Can It Rebound?
Cerebras (CBRS) reported earnings 30 days ago. What's next for the stock?

AI & Robotics in 2026: 16 Recent Developments for Investors
If AI and robotics suddenly feel like they are moving faster, August gave investors plenty of evidence that the pace really is accelerating. We saw longer-running agents, faster and cheaper inference, AI systems reaching into laboratories and physical equipment, robots learning from fewer demonstrations, and new capital and infrastructure forming around commercial deployment.

Cathie Wood Goes Bargain Hunting: 3 Stocks She Just Bought
Ark Invest added to three existing positions that are trading well below their recent highs.
Cerebras: The Inference Bottleneck Winner
Cerebras holds $25.4 billion of RPO, but only 22% should convert into revenue through June 2028. Cloud and services revenue surged 287% YoY to $127.7 million as Cerebras increasingly monetizes inference rather than hardware. More than 600MW of secured capacity shifts Cerebras' primary growth constraint from semiconductor availability toward data center deployment.
Cathie Wood Just Went Bargain Hunting. Here Are the 3 AI Stocks She Bought.
Ark expects Nvidia to remain the lead supplier for AI servers even as custom chips gain market share. Wood also likes the prospects of emerging challengers like Cerebras Systems in the AI compute market.

Cerebras Has a $25.4 Billion Backlog, and One OpenAI Agreement Is Behind Much of It
Cerebras grew its second-quarter adjusted revenue 103% year over year to $209.9 million. Remaining performance obligations reached $25.4 billion as of June 30, and a significant amount of that balance traces to a December agreement with OpenAI.

Cerebras ja Compute Nordic Finland rakentavat uuden 165 megawatin datakeskuksen Mikkeliin
MIKKELI, Suomi, Sept. 02, 2026 (GLOBE NEWSWIRE) -- Cerebras Systems (NASDAQ: CBRS) julkisti tänään uuden tekoälykäyttöön tarkoitetun datakeskushankkeen Mikkelissä. Datakeskuksen kehityksessä on mukana Compute Nordic Finland. Laitoksen IT-kapasiteetti kasvaa vähitellen sopimukseen perustuen 165 megawattiin, jotta se voi tarjota tehokasta tekoälylaskentaa. Ensimmäisen 50 megawattia tarjoavan osan rakentaminen on jo meneillään.
Similar companies
-
 Astera Labs, Inc. Common Stock
ALAB
·
NASDAQ
Compare
Astera Labs, Inc. Common Stock
ALAB
·
NASDAQ
Compare
-
 Aevex Corp.
AVEX
·
New York Stock Exchange
Compare
Aevex Corp.
AVEX
·
New York Stock Exchange
Compare
-
 Fervo Energy Company
FRVO
·
NASDAQ
Compare
Fervo Energy Company
FRVO
·
NASDAQ
Compare
-
 Swarmer, Inc Common Stock
SWMR
·
NASDAQ
Compare
Swarmer, Inc Common Stock
SWMR
·
NASDAQ
Compare
-
 Voyager Technologies, Inc.
VOYG
·
New York Stock Exchange
Compare
Voyager Technologies, Inc.
VOYG
·
New York Stock Exchange
Compare
-
 X-Energy, Inc. Class A Common Stock
XE
·
NASDAQ
Compare
X-Energy, Inc. Class A Common Stock
XE
·
NASDAQ
Compare