AI Analysis

Generated: 6 weeks ago. (Likely Outdated!)

"Here's an analysis of BHP Group Limited, designed to be clear and easy to understand for any investor.\n\n### 1. The Business Model (How They Make Money)\n\nBHP Group Limited is a giant in the world of natural resources, essentially acting as a global supplier of essential raw materials. Think of them as a massive quarry and processing operation that digs up valuable minerals from the earth and sells them to industries worldwide. Their core business revolves around finding, extracting, and processing these materials, which are then used to build everything from cars and buildings to fertilizers for crops.\n\nTheir primary products and services include:\n* Iron Ore: This is the main ingredient for steel, which is used extensively in construction, manufacturing, and infrastructure projects. BHP is a major global producer of iron ore, and it remains a cornerstone of their profitability.\n* Copper: A crucial metal for electrical wiring, plumbing, and increasingly, for renewable energy technologies and electric vehicles. BHP has been actively growing its copper business, and it contributed a significant portion of their earnings in recent periods.\n* Coal: They produce both metallurgical coal (used in steelmaking) and energy coal (used for power generation).\n* Potash: This mineral is a key ingredient in fertilizers, essential for agricultural productivity. BHP is investing in new potash projects to meet future demand.\n\nIn the fiscal year 2025, BHP reported total revenue of US$51.3 billion. Their copper business has been a growing contributor, making up 45% of the Group's underlying operational profit (EBITDA) in FY2025. More recently, in the first half of fiscal year 2026, copper's contribution to the Group's underlying operational profit increased to 51%, highlighting its growing importance to the company's earnings.\n\n### 2. The Metrics That Matter Most\n\nFor a company like BHP, which is all about digging up and selling natural resources, certain financial numbers give us the best picture of its health and future prospects. Here are the most important ones:\n\n* Revenue: This is the total amount of money BHP brings in from selling its minerals before any expenses are taken out. For FY2025, BHP's revenue was US$51.3 billion. It's the starting point for understanding how much business they're doing. For a mining company, revenue is heavily influenced by both the volume of minerals they dig up and the global prices of those commodities. A higher revenue generally means they're selling more or getting better prices for their products.\n\n* Net Income: This tells us how much profit BHP actually made after paying for all its operating costs, interest on debt, and taxes. In FY2025, BHP's net income was US$9.0 billion. This metric is the ultimate measure of a company's profitability. For BHP, a strong net income indicates they are efficiently managing their costs and benefiting from commodity prices, leading to more money left over for shareholders or reinvestment.\n\n* Operating Cash Flow: This shows the cash generated purely from BHP's day-to-day mining and selling activities, before accounting for big investments or financing decisions. In FY2025, BHP generated US$18.7 billion in net operating cash flow. For a mining company, this is super important because it shows how much cash their core business is throwing off. This cash is then used to fund new projects, pay down debt, and return money to shareholders. A healthy operating cash flow means the company has a strong foundation to support its operations and growth.\n\n* Capital Expenditure (CapEx): This represents the money BHP spends on buying, maintaining, or upgrading its physical assets, like mines, equipment, and processing plants. In FY2025, BHP invested US$9.8 billion in capital and exploration expenditure. For a mining company, CapEx is a huge deal. It's how they keep their existing mines running, explore for new deposits, and build new mines to ensure they have resources to sell in the future. High CapEx can signal future growth, but it also means a lot of cash is being tied up in long-term projects.\n\n* Dividends: These are payments made by the company to its shareholders, usually from its profits. For FY2025, BHP paid total dividends of US$1.10 per share, amounting to US$5.6 billion. Many investors in mature resource companies like BHP look for consistent and generous dividends. It shows that the company is generating enough cash to not only run its business and invest for the future but also to directly reward its owners.\n\n### 3. How to Value This Company\n\nTo figure out if BHP's stock is a good deal or too expensive, the most relevant metric is the Free Cash Flow Yield (FCF Yield).\n\nWhat it is: Free Cash Flow Yield tells you how much actual cash a company generates for every dollar of its market value. Think of ""free cash flow"" as the money left over after the company has paid all its bills and invested in everything it needs to keep its business running and growing. It's the cash that's truly ""free"" for the company to do whatever it wants with – like paying down debt, buying back shares, or paying dividends.\n\nWhy it's the best for BHP: For a mining company like BHP, which requires huge upfront investments in mines and equipment (CapEx) and deals with fluctuating commodity prices, looking at traditional profit numbers can sometimes be misleading. Free Cash Flow Yield cuts through that by focusing on the actual cash the business generates. It's a more direct measure of the company's financial strength and its ability to reward shareholders. A higher FCF Yield generally suggests that the company is generating a lot of cash relative to its stock price, which can indicate that the stock might be undervalued or offers a good return potential. For example, if a company has a 10% FCF Yield, it means it's generating 10 cents of free cash flow for every dollar of its stock price. This is particularly useful for a mature, dividend-paying company like BHP, as it highlights the cash available for shareholder returns. In FY2025, BHP reported free cash flow of US$5.3 billion."

⚠️ Disclaimer: This analysis is generated by AI. stockpicker.tech is not responsible for any mistakes, inaccuracies, or hallucinations. This is for educational purposes only and does not constitute financial advice. Users should always double-check the information and conduct their own research before making investment decisions.

Log in to generate a MOAT report for this stock.

Log in to generate an earnings report for this stock.

Log in to generate an operating leverage report for this stock.

Log in to generate a management report for this stock.

Log in to generate a valuation report for this stock.

BHP Group Limited

$87.15 +$25.39 (+41.11%)
NYSE · 11 Sep 2026 20:00 UTC
Previous Close
$87.35
Day Range
$86.68$88.2
Year Range
$51.83$98.71
Market Cap
221.39B
AVG Volume
2.68M
Trailing/Forward PE
22.5/17.8
PEG ratio
118.96
Dividend Yield
3.97%
Next Earnings Date
2027-02-23
Primary Exchange
New York Stock ExchangeUS
Revenue (USD)
010B20B30B40B22 Q222 Q423 Q223 Q424 Q224 Q425 Q225 Q426 Q226 Q4
BHP Revenue (USD) by quarter
PeriodRevenue (USD)
26 Q430.96B
26 Q227.95B
25 Q426.09B
25 Q225.18B
24 Q428.43B
24 Q227.23B
23 Q427.83B
23 Q225.98B
22 Q434.58B
22 Q230.83B
Net Income (USD)
010B20B30B22 Q222 Q423 Q223 Q424 Q224 Q425 Q225 Q426 Q226 Q4
BHP Net Income (USD) by quarter
PeriodNet Income (USD)
26 Q44.21B
26 Q25.65B
25 Q44.6B
25 Q24.42B
24 Q46.97B
24 Q2927M
23 Q46.46B
23 Q26.46B
22 Q421.46B
22 Q29.44B
Operating Income (USD)
05B10B15B20B22 Q222 Q423 Q223 Q424 Q224 Q425 Q225 Q426 Q226 Q4
BHP Operating Income (USD) by quarter
PeriodOperating Income (USD)
26 Q411.08B
26 Q211.98B
25 Q410.34B
25 Q29.13B
24 Q412.73B
24 Q24.8B
23 Q412.1B
23 Q210.83B
22 Q419.26B
22 Q214.85B
EBITDA (USD)
05B10B15B20B22 Q222 Q423 Q223 Q424 Q224 Q425 Q225 Q426 Q226 Q4
BHP EBITDA (USD) by quarter
PeriodEBITDA (USD)
26 Q414.37B
26 Q214.9B
25 Q412.01B
25 Q211.43B
24 Q413.89B
24 Q212.95B
23 Q413.04B
23 Q212.47B
22 Q419.89B
22 Q217.76B
Cash Flows (USD)
05B10B15B20B22 Q222 Q423 Q223 Q424 Q224 Q425 Q225 Q426 Q226 Q4
BHP Cash Flows (USD) by quarter
PeriodCash Flows (USD)
26 Q47.66B
26 Q24.31B
25 Q45.99B
25 Q23.31B
24 Q47.25B
24 Q24.14B
23 Q47.88B
23 Q23.74B
22 Q415.66B
22 Q210.4B
EPS (USD)
024622 Q222 Q423 Q223 Q424 Q224 Q425 Q225 Q426 Q226 Q4
BHP EPS (USD) by quarter
PeriodEPS (USD)
26 Q41.66
26 Q22.22
25 Q41.82
25 Q21.74
24 Q42.74
24 Q20.36
23 Q42.54
23 Q22.54
22 Q44.64
22 Q23.34
Expenses (USD)
05B10B15B20BR&DSG&ACapex22 Q222 Q423 Q223 Q424 Q224 Q425 Q225 Q426 Q226 Q4
BHP Expenses (USD) by quarter
PeriodExpenses (USD)
26 Q44.8B
26 Q25.08B
25 Q417.86B
25 Q25.01B
24 Q417.96B
24 Q24.74B
23 Q416.26B
23 Q23.03B
22 Q414.79B
22 Q22.88B
Cash & Debt (USD)
010B20B30BCashLong Term DebtShort Term Debt22 Q222 Q423 Q223 Q424 Q224 Q425 Q225 Q426 Q226 Q4
BHP Cash & Debt (USD) by quarter
PeriodCash & Debt (USD)
26 Q418.6B
26 Q213.81B
25 Q412.17B
25 Q29.86B
24 Q412.65B
24 Q210.35B
23 Q412.46B
23 Q29.93B
22 Q417.54B
22 Q212.52B
Debt ratios
-0.100.10.20.30.422 Q222 Q423 Q223 Q424 Q224 Q425 Q225 Q426 Q226 Q4
BHP Debt ratios by quarter
PeriodDebt ratios
26 Q40.16
26 Q20.34
25 Q40.25
25 Q20.2
24 Q40.14
24 Q20.21
23 Q40.16
23 Q20.07
22 Q4-0.02
22 Q20.11
Margins
0%50%100%150%22 Q222 Q423 Q223 Q424 Q224 Q425 Q225 Q426 Q226 Q4
BHP Margins by quarter
PeriodMargins
26 Q435.78%
26 Q242.85%
25 Q4126.13%
25 Q236.71%
24 Q4122.86%
24 Q239.67%
23 Q4115.85%
23 Q240.88%
22 Q4118.33%
22 Q249.15%
Return on Capital
0%20%40%60%22 Q222 Q423 Q223 Q424 Q224 Q425 Q225 Q426 Q226 Q4
BHP Return on Capital by quarter
PeriodReturn on Capital
26 Q47.47%
26 Q210.19%
25 Q48.81%
25 Q28.9%
24 Q414.19%
24 Q22.03%
23 Q413.32%
23 Q213.87%
22 Q444%
22 Q217.19%
Shares Outstanding
01B2B3B22 Q222 Q423 Q223 Q424 Q224 Q425 Q225 Q426 Q226 Q4
BHP Shares Outstanding by quarter
PeriodShares Outstanding
26 Q42.54B
26 Q22.54B
25 Q42.54B
25 Q22.54B
24 Q42.54B
24 Q22.53B
23 Q42.54B
23 Q22.54B
22 Q42.54B
22 Q22.54B
Dividends (USD)
01234Feb 22Sep 22Mar 23Sep 23Mar 24Sep 24Mar 25Sep 25Mar 26Sep 26
BHP Dividends (USD) by quarter
PeriodDividends (USD)
Sep 261.98
Mar 261.46
Sep 251.2
Mar 251
Sep 241.48
Mar 241.44
Sep 231.58
Mar 231.78
Sep 223.48
Feb 223
Employee Count
025K50K75K100K2017201820192020202120222023202420252026
BHP Employee Count by quarter
PeriodEmployee Count
202686K
202590K
202490K
202380K
202280K
202180K
202021K
201972K
201862K
201760K
Book Value Per Share (USD)
010203022 Q222 Q423 Q223 Q424 Q224 Q425 Q225 Q426 Q226 Q4
BHP Book Value Per Share (USD) by quarter
PeriodBook Value Per Share (USD)
26 Q422.18
26 Q221.85
25 Q420.55
25 Q219.52
24 Q419.34
24 Q218
23 Q419.13
23 Q218.36
22 Q419.24
22 Q221.65
Total Assets (USD)
050B100B150B22 Q222 Q423 Q223 Q424 Q224 Q425 Q225 Q426 Q226 Q4
BHP Total Assets (USD) by quarter
PeriodTotal Assets (USD)
26 Q4121.39B
26 Q2116.01B
25 Q4108.79B
25 Q2100.72B
24 Q4102.36B
24 Q299.99B
23 Q4101.3B
23 Q287.82B
22 Q495.17B
22 Q2105.72B
PE Ratio
468101214med 8.14Dec 24Apr 25Jul 25Oct 25Feb 26May 26Sep 26
BHP PE Ratio by quarter
PeriodPE Ratio
Sep 2611.73
Sep 2612.17
Aug 2612.8
Aug 2613.06
Aug 2611.68
Aug 2612.16
Jul 2611.37
Jul 2611.26
Jul 2610.85
Jul 269.58
Jul 269.78
Jun 269.5
Jun 2610.31
Jun 2610.65
Jun 269.7
May 2610.43
May 269.92
May 269.9
May 269.94
May 269.27
Apr 269.36
Apr 269.44
Apr 269.01
Apr 268.59
Mar 268.15
Mar 267.66
Mar 268.06
Mar 268.43
Feb 269.57
Feb 269.01
Feb 2611.02
Feb 2610.46
Jan 2610.33
Jan 2610.14
Jan 269.74
Jan 269.27
Jan 269.28
Dec 259.3
Dec 258.91
Dec 258.96
Dec 258.84
Nov 258.22
Nov 257.97
Nov 258.3
Nov 258.29
Oct 258.57
Oct 258.36
Oct 258.35
Oct 258.06
Oct 258.33
Sep 258.22
Sep 257.83
Sep 258.12
Sep 258.17
Aug 258.38
Aug 258.41
Aug 257.33
Aug 257.15
Aug 256.86
Jul 257.19
Jul 257.01
Jul 257.05
Jul 256.84
Jun 256.58
Jun 256.24
Jun 256.57
Jun 256.71
May 256.63
May 256.75
May 256.83
May 256.59
May 256.61
Apr 256.52
Apr 256.29
Apr 256.12
Apr 255.69
Mar 256.62
Mar 256.65
Mar 256.69
Mar 256.79
Feb 256.56
Feb 256.96
Feb 256.29
Feb 256.14
Jan 256
Jan 256.08
Jan 256.11
Jan 255.92
Jan 255.95
Dec 246
Dec 246
Dec 246.3
Dec 246.27
Nov 246.42
Nov 246.39
Nov 246.32
Nov 246.73
Nov 246.82
Oct 246.89
Oct 246.97
Free Cash Flow Yield
5%10%15%20%25%med 14.87%Dec 24Apr 25Jul 25Oct 25Feb 26May 26Sep 26
BHP Free Cash Flow Yield by quarter
PeriodFree Cash Flow Yield
Sep 269.61%
Sep 269.26%
Aug 268.8%
Aug 268.63%
Aug 269.65%
Aug 269.26%
Jul 269.91%
Jul 2610%
Jul 2610.38%
Jul 2610.06%
Jul 269.86%
Jun 2610.14%
Jun 269.35%
Jun 269.05%
Jun 269.93%
May 269.24%
May 269.71%
May 269.74%
May 269.7%
May 2610.39%
Apr 2610.29%
Apr 2610.21%
Apr 2610.7%
Apr 2611.22%
Mar 2611.82%
Mar 2612.59%
Mar 2611.95%
Mar 2611.44%
Feb 2610.07%
Feb 2610.7%
Feb 2611.09%
Feb 2611.69%
Jan 2611.84%
Jan 2612.06%
Jan 2612.55%
Jan 2613.19%
Jan 2613.18%
Dec 2513.15%
Dec 2513.72%
Dec 2513.65%
Dec 2513.83%
Nov 2514.87%
Nov 2515.34%
Nov 2514.74%
Nov 2514.76%
Oct 2514.27%
Oct 2514.64%
Oct 2514.64%
Oct 2515.18%
Oct 2514.68%
Sep 2514.87%
Sep 2515.61%
Sep 2515.06%
Sep 2514.97%
Aug 2514.6%
Aug 2514.55%
Aug 2516.41%
Aug 2516.81%
Aug 2517.52%
Jul 2516.72%
Jul 2517.14%
Jul 2517.06%
Jul 2517.59%
Jun 2518.28%
Jun 2519.26%
Jun 2518.3%
Jun 2517.92%
May 2518.14%
May 2517.81%
May 2517.59%
May 2518.26%
May 2518.2%
Apr 2518.43%
Apr 2519.11%
Apr 2519.64%
Apr 2521.12%
Mar 2518.16%
Mar 2518.08%
Mar 2517.97%
Mar 2517.72%
Feb 2518.33%
Feb 2517.27%
Feb 2517.58%
Feb 2517.99%
Jan 2518.43%
Jan 2518.17%
Jan 2518.09%
Jan 2518.67%
Jan 2518.56%
Dec 2418.41%
Dec 2418.42%
Dec 2417.53%
Dec 2417.63%
Nov 2417.21%
Nov 2417.3%
Nov 2417.48%
Nov 2416.42%
Nov 2416.2%
Oct 2416.05%
Oct 2415.86%
Price to Sales
0.511.522.5med 1.31Dec 24Apr 25Jul 25Oct 25Feb 26May 26Sep 26
BHP Price to Sales by quarter
PeriodPrice to Sales
Sep 262.01
Sep 262.08
Aug 262.19
Aug 262.24
Aug 262
Aug 262.08
Jul 261.95
Jul 261.93
Jul 261.86
Jul 261.93
Jul 261.97
Jun 261.91
Jun 262.07
Jun 262.14
Jun 261.95
May 262.1
May 262
May 261.99
May 262
May 261.86
Apr 261.88
Apr 261.9
Apr 261.81
Apr 261.73
Mar 261.64
Mar 261.54
Mar 261.62
Mar 261.69
Feb 261.92
Feb 261.81
Feb 261.74
Feb 261.66
Jan 261.63
Jan 261.6
Jan 261.54
Jan 261.47
Jan 261.47
Dec 251.47
Dec 251.41
Dec 251.42
Dec 251.4
Nov 251.3
Nov 251.26
Nov 251.31
Nov 251.31
Oct 251.36
Oct 251.32
Oct 251.32
Oct 251.27
Oct 251.32
Sep 251.3
Sep 251.24
Sep 251.29
Sep 251.29
Aug 251.33
Aug 251.33
Aug 251.27
Aug 251.24
Aug 251.19
Jul 251.24
Jul 251.21
Jul 251.22
Jul 251.18
Jun 251.14
Jun 251.08
Jun 251.14
Jun 251.16
May 251.15
May 251.17
May 251.18
May 251.14
May 251.14
Apr 251.13
Apr 251.09
Apr 251.06
Apr 250.98
Mar 251.14
Mar 251.15
Mar 251.16
Mar 251.17
Feb 251.13
Feb 251.2
Feb 251.2
Feb 251.17
Jan 251.14
Jan 251.16
Jan 251.16
Jan 251.13
Jan 251.13
Dec 241.14
Dec 241.14
Dec 241.2
Dec 241.19
Nov 241.22
Nov 241.21
Nov 241.2
Nov 241.28
Nov 241.3
Oct 241.31
Oct 241.33
EV/EBITDA
2345med 3.01Dec 24Apr 25Jul 25Oct 25Feb 26May 26Sep 26
BHP EV/EBITDA by quarter
PeriodEV/EBITDA
Sep 264.36
Sep 264.52
Aug 264.75
Aug 264.84
Aug 264.34
Aug 264.52
Jul 264.23
Jul 264.2
Jul 264.05
Jul 264.31
Jul 264.39
Jun 264.28
Jun 264.61
Jun 264.75
Jun 264.36
May 264.66
May 264.45
May 264.44
May 264.46
May 264.18
Apr 264.22
Apr 264.25
Apr 264.07
Apr 263.9
Mar 263.72
Mar 263.51
Mar 263.68
Mar 263.83
Feb 264.3
Feb 264.07
Feb 263.95
Feb 263.77
Jan 263.72
Jan 263.66
Jan 263.52
Jan 263.36
Jan 263.37
Dec 253.37
Dec 253.24
Dec 253.26
Dec 253.22
Nov 253.01
Nov 252.93
Nov 253.04
Nov 253.03
Oct 253.13
Oct 253.06
Oct 253.05
Oct 252.96
Oct 253.05
Sep 253.01
Sep 252.88
Sep 252.98
Sep 252.99
Aug 253.06
Aug 253.07
Aug 252.88
Aug 252.82
Aug 252.71
Jul 252.83
Jul 252.77
Jul 252.78
Jul 252.7
Jun 252.61
Jun 252.49
Jun 252.61
Jun 252.66
May 252.63
May 252.67
May 252.7
May 252.61
May 252.62
Apr 252.59
Apr 252.5
Apr 252.44
Apr 252.28
Mar 252.62
Mar 252.63
Mar 252.65
Mar 252.68
Feb 252.6
Feb 252.75
Feb 252.64
Feb 252.59
Jan 252.53
Jan 252.56
Jan 252.57
Jan 252.5
Jan 252.51
Dec 242.53
Dec 242.53
Dec 242.65
Dec 242.64
Nov 242.7
Nov 242.68
Nov 242.66
Nov 242.82
Nov 242.86
Oct 242.88
Oct 242.91
Price/Operating Cashflow
234567med 3.57Dec 24Apr 25Jul 25Oct 25Feb 26May 26Sep 26
BHP Price/Operating Cashflow by quarter
PeriodPrice/Operating Cashflow
Sep 265.46
Sep 265.66
Aug 265.96
Aug 266.08
Aug 265.44
Aug 265.66
Jul 265.29
Jul 265.24
Jul 265.05
Jul 265.2
Jul 265.31
Jun 265.16
Jun 265.6
Jun 265.78
Jun 265.27
May 265.66
May 265.39
May 265.37
May 265.39
May 265.03
Apr 265.08
Apr 265.12
Apr 264.89
Apr 264.66
Mar 264.43
Mar 264.16
Mar 264.38
Mar 264.57
Feb 265.19
Feb 264.89
Feb 264.74
Feb 264.5
Jan 264.44
Jan 264.36
Jan 264.19
Jan 263.99
Jan 263.99
Dec 254
Dec 253.83
Dec 253.85
Dec 253.8
Nov 253.53
Nov 253.43
Nov 253.57
Nov 253.56
Oct 253.68
Oct 253.59
Oct 253.59
Oct 253.46
Oct 253.58
Sep 253.53
Sep 253.37
Sep 253.49
Sep 253.51
Aug 253.6
Aug 253.61
Aug 253.36
Aug 253.28
Aug 253.15
Jul 253.3
Jul 253.22
Jul 253.23
Jul 253.14
Jun 253.02
Jun 252.87
Jun 253.02
Jun 253.08
May 253.04
May 253.1
May 253.14
May 253.02
May 253.03
Apr 252.99
Apr 252.89
Apr 252.81
Apr 252.61
Mar 253.04
Mar 253.05
Mar 253.07
Mar 253.12
Feb 253.01
Feb 253.19
Feb 253.33
Feb 253.25
Jan 253.17
Jan 253.22
Jan 253.23
Jan 253.13
Jan 253.15
Dec 243.17
Dec 243.17
Dec 243.33
Dec 243.32
Nov 243.4
Nov 243.38
Nov 243.34
Nov 243.56
Nov 243.61
Oct 243.64
Oct 243.69
Price to Book
2345med 2.72Dec 24Apr 25Jul 25Oct 25Feb 26May 26Sep 26
BHP Price to Book by quarter
PeriodPrice to Book
Sep 263.93
Sep 264.08
Aug 264.29
Aug 264.38
Aug 263.91
Aug 264.08
Jul 263.81
Jul 263.78
Jul 263.64
Jul 263.74
Jul 263.81
Jun 263.71
Jun 264.02
Jun 264.16
Jun 263.79
May 264.07
May 263.87
May 263.86
May 263.88
May 263.62
Apr 263.65
Apr 263.68
Apr 263.52
Apr 263.35
Mar 263.18
Mar 262.99
Mar 263.15
Mar 263.29
Feb 263.73
Feb 263.52
Feb 263.57
Feb 263.39
Jan 263.35
Jan 263.29
Jan 263.16
Jan 263
Jan 263.01
Dec 253.01
Dec 252.89
Dec 252.9
Dec 252.86
Nov 252.66
Nov 252.58
Nov 252.69
Nov 252.68
Oct 252.78
Oct 252.71
Oct 252.71
Oct 252.61
Oct 252.7
Sep 252.66
Sep 252.54
Sep 252.63
Sep 252.65
Aug 252.71
Aug 252.72
Aug 252.77
Aug 252.71
Aug 252.6
Jul 252.72
Jul 252.66
Jul 252.67
Jul 252.59
Jun 252.49
Jun 252.36
Jun 252.49
Jun 252.54
May 252.51
May 252.56
May 252.59
May 252.49
May 252.5
Apr 252.47
Apr 252.38
Apr 252.32
Apr 252.16
Mar 252.51
Mar 252.52
Mar 252.53
Mar 252.57
Feb 252.48
Feb 252.64
Feb 252.67
Feb 252.6
Jan 252.54
Jan 252.58
Jan 252.59
Jan 252.51
Jan 252.52
Dec 242.54
Dec 242.54
Dec 242.67
Dec 242.66
Nov 242.72
Nov 242.71
Nov 242.68
Nov 242.85
Nov 242.89
Oct 242.92
Oct 242.95
BHP Group Limited
BHP
Stockpicker

Video analysis: BHP

All videos

No video analysis for this stock yet. Request one from our team.

Your email is used only to follow up on this request. We do not add you to marketing lists. Privacy Policy

News: BHP

Australian union backs class action against BHP over public holiday work

reuters.com · 10 Sep 2026

Australian union backs class action against BHP over public holiday work

An Australian mining union is funding a class action against BHP ​that could cover up to 7,000 ‌workers employed by the miner's labour hire subsidiaries.
NHYDY or BHP: Which Is the Better Value Stock Right Now?

zacks.com · 9 Sep 2026

NHYDY or BHP: Which Is the Better Value Stock Right Now?

Investors with an interest in Mining - Miscellaneous stocks have likely encountered both Norsk Hydro ASA (NHYDY) and BHP (BHP). But which of these two companies is the best option for those looking for undervalued stocks?
BHP, union talks for Port Hedland iron ore workers to stretch on into next week

reuters.com · 8 Sep 2026

BHP, union talks for Port Hedland iron ore workers to stretch on into next week

Talks between BHP and unions representing workers at the mining giant's Port Hedland iron ore operations in ​Western Australia ended without a deal, with further negotiations ‌scheduled for next week, the parties said on Tuesday.

Albemarle names BHP executive Ragnar Udd as CEO

reuters.com · 3 Sep 2026

Albemarle names BHP executive Ragnar Udd as CEO

Albemarle said ‌on Thursday it has appointed BHP executive ​Ragnar Udd as ​its CEO, tapping an ⁠industry veteran to ​lead the lithium producer.

Copper Surges as Shifting Trade Policy and AI Demand Collide

marketbeat.com · 2 Sep 2026

Copper Surges as Shifting Trade Policy and AI Demand Collide

Investors looking to capitalize on the artificial intelligence infrastructure boom have increasingly turned to basic materials, and industrial metals—copper chief among them—are having a moment few saw coming even a year ago. What started as a trade-policy story has fused with a structural demand story, and the combination is rewriting price records almost weekly.
FCX vs. BHP: Which Copper Mining Giant Should You Bet on Now?

zacks.com · 27 Aug 2026

FCX vs. BHP: Which Copper Mining Giant Should You Bet on Now?

Freeport and BHP Group capitalize on favorable copper prices, both pushing ahead with growth projects leveraging strong financial health.
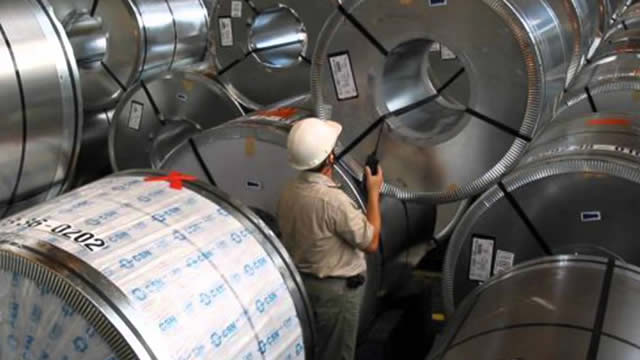
Port Hedland unions place wage deal counterproposal to BHP ahead of September 8 talks

reuters.com · 25 Aug 2026

Port Hedland unions place wage deal counterproposal to BHP ahead of September 8 talks

The Combined ​BHP Ports Unions has placed a counterproposal ‌on a wage deal for workers at its Port Hedland operations in Western Australia ahead of ​their next meeting on September 8, it ​said on Tuesday, after workers rejected a ⁠proposal from BHP.

Mariana, 18 more Brazil cities join Vale-BHP dam collapse compensation deal

reuters.com · 20 Aug 2026

Mariana, 18 more Brazil cities join Vale-BHP dam collapse compensation deal

The compensation agreement with miners BHP , Vale and Samarco for the Mariana dam collapse in 2015 has been joined by 19 new cities, ​including the one that was the epicenter of the disaster, a Brazilian ‌court said on Thursday.

Similar companies

Disclaimer: The historical data presented on this platform is provided by Financial Modeling Prep. Stock Picker is a platform for informational purposes only and does not provide financial advice. Users are encouraged to conduct their own research and consult with a qualified financial advisor before making investment decisions.