

How Lazy Investors Are Beating The Market
Without Lifting A Finger
This revolutionary visual analysis platform turns complex stock data into crystal-clear insights, giving you the power to analyze any stock in minutes—not days or weeks.
"I made 25% profit for less than one year, using this stock analysis website and common sense."
Credit card required
Free 7-day trial
Why You're Losing Money on "Hot Stock Tips"
The Brutal Truth
While you're buying stocks based on CNBC headlines, Reddit tips, and "expert" predictions... professional investors are making fortunes using data you don't know how to read.
You're Flying Blind
Buying stocks based on media hype and "gut feelings" instead of actual company fundamentals and performance data.
Financial Reports Are Like Greek To You
Earnings reports, balance sheets, and financial statements might as well be written in a foreign language.
You Don't Have Professional-Level Tools
Wall Street pros have access to sophisticated analysis tools while you're stuck with basic charts and outdated information.
Media Hype Leads to Devastating Losses
Following CNBC "experts" and social media tips instead of looking at real company performance data.
STOP!
You're Investing Like An Amateur While Pros Eat Your Lunch
❌ Buying stocks based on media headlines
❌ Can't read financial statements properly
❌ No access to professional analysis tools
❌ Following tips instead of fundamentals
There HAS To Be A Better Way...
(Spoiler alert: There is, and it's ridiculously simple)
Finally: Invest Like A Wall Street Pro
Without The MBA
Introducing Stockpicker.tech - The visual analysis platform that shows company fundamentals and past performance through easy-to-understand charts, giving you professional-level insights without the complexity.
See Company Performance At A Glance
Stop trying to decode complex financial reports. Our visual charts instantly show you a company's past performance, revenue trends, profitability, and growth patterns in simple, colorful graphics. No accounting degree required.
Professional-Grade Fundamentals Made Simple
No more buying based on media hype. See the same fundamental data that Wall Street pros use, but presented in simple visual format that anyone can understand. Revenue growth, profit margins, debt levels - all clearly displayed.
Spot Winning Patterns Like The Pros
Learn to recognize the same patterns that professional investors look for. Our visual system highlights companies with strong fundamentals and consistent performance - the kind of data-driven insights that separate pros from amateurs.
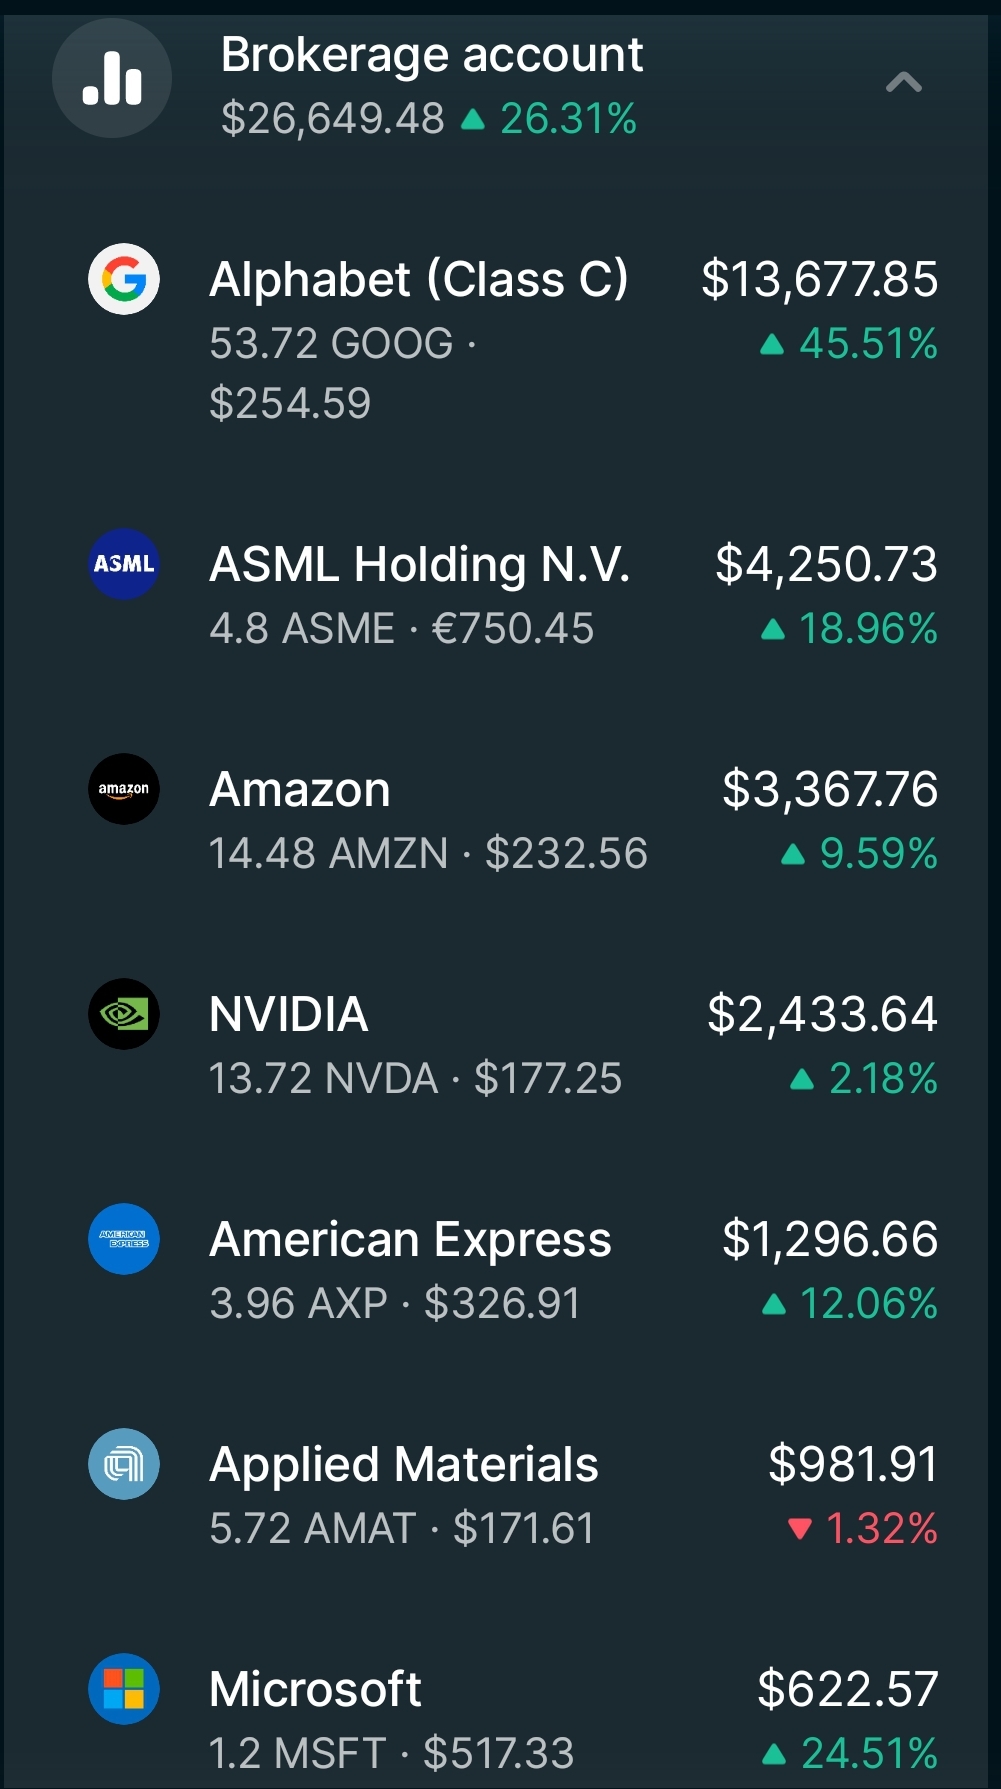
✅ Easy Visual Analysis
Clear, colorful charts show revenue growth at a glance. Performance indicators with color-coded growth rates make it instantly clear whether a company is growing or declining.
The Results Speak For Themselves
Amateur Investors
- ❌ Buying stocks based on headlines
- ❌ Poor investment performance
- ❌ Can't read financial statements
- ❌ Frequent emotional decisions
- ❌ No access to professional data
Stockpicker.tech Users
- ✅ See fundamentals in visual format
- ✅ Better informed decisions
- ✅ Understand company performance
- ✅ Professional-grade insights
- ✅ Starting at just $10/month
Which path will YOU choose?
See The Difference
For Yourself
Compare how Stockpicker.tech presents company data versus traditional financial websites. The visual difference is clear.
✅ Stockpicker.tech Advantage
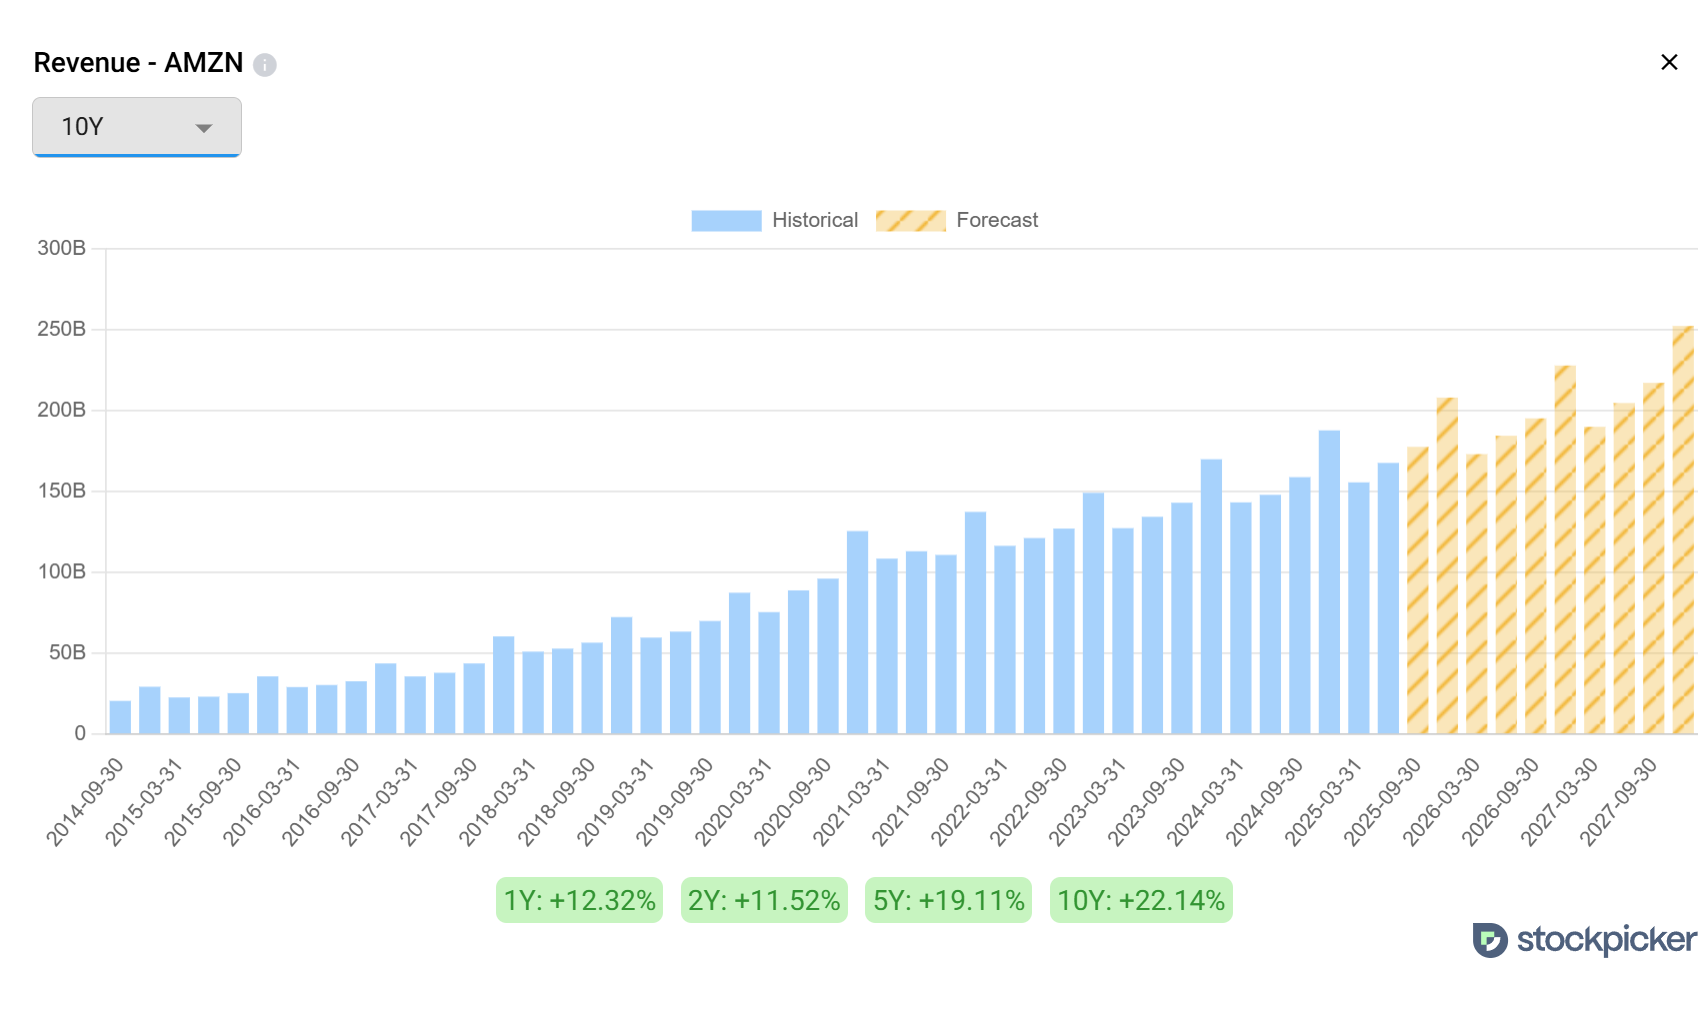
Visual Revenue Growth
See Amazon's revenue growth instantly with color-coded bars. Historical data in blue, forecasts in yellow/orange pattern - no confusion.
Growth Rate Indicators
Clear percentage indicators (1Y: +12.32%, 2Y: +11.52%) show exactly how fast the company is growing.
Professional Branding
Clean, professional interface that makes complex financial data accessible to everyone, not just Wall Street experts.
Which Would You Rather Use?
Stop struggling with confusing data tables. Start making investment decisions based on clear, visual company fundamentals that anyone can understand.
The Future of Investing
is HERE
Stop working hard and start working SMART.
Join the investors who are making better informed decisions with visual analysis. While others struggle with complex reports, you'll see company fundamentals clearly.
✅ 7-Day Free Trial
✅ Credit Card Required
✅ Cancel Anytime
💰 SIMPLE PRICING
Just $10/month for visual analysis or $120/month with monthly coaching calls.
📊 Professional-Grade Analysis Made Simple
See company fundamentals the way Wall Street pros do, but in easy-to-understand visual format. No financial education required - our charts make complex data crystal clear.
Stop investing blind - start investing smart.
Every investment decision should be based on data, not headlines. Start today.
Media bias, clickbait headlines, and social media trends can result in buying into bubbles at their peak and selling great companies during temporary downturns.
See What Our Users Say About Visual Analysis
"I made 25% profit for less than one year, using this stock analysis website and common sense."
- Verified Stockpicker.tech User
Frequently Asked Questions
We know you might have some doubts. Here are the answers to the most common questions from people just like you.
Still on the fence?
We get it. You've probably been burned by other "investment systems" before. That's exactly why we offer a 7-day free trial so you can see exactly how our visual analysis works.
Try it risk-free and see the difference for yourself.